

The narrative is compelling. Tamil Nadu’s investment narrative is built on headline MoUs and global summit announcements. Tamil Nadu, we are told, is India’s most investor-friendly state. So why, year after year, does the government end up spending ₹ 40,000–60,000 crore more than it earns?
Every Year, the State Spends More Than It Earns. Every Single Year.
Think of the State government as a household. It earns income through taxes, central grants, and fees. It spends on salaries, pensions, committed expenditure programmes, roads, and hospitals. A responsible household tries to keep its spending within its income. Tamil Nadu has not managed this in at least nine consecutive years.
The chart below tells the whole story at once. The teal bars are what the State collects. The red bars are what it spends and noticeably the red bar is always taller, not once, not in a bad year, but every single year. The dotted lines show how Tamil Nadu’s revenue deficit as a share of GSDP compares with Gujarat and Maharashtra, context that makes the persistence of TN’s gap hard to dismiss.
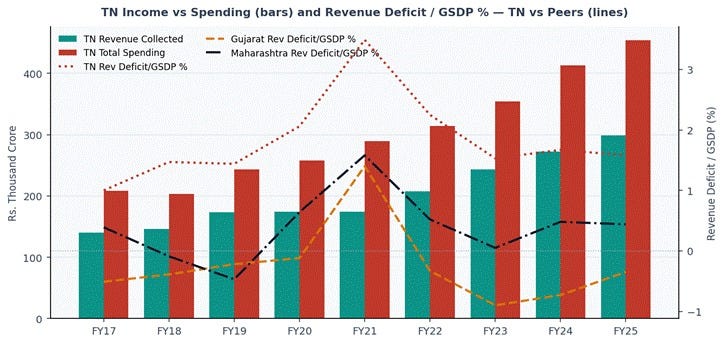
Tamil Nadu’s fiscal problem is more of the structural nature and growth alone is not fixing it. In FY17, the State’s revenue deficit was 1.0% of its economy. By FY21, at the COVID peak, it hit 3.49%. It has since recovered, but only to 1.58%, a floor that has not broken since FY17. The deficit persisted even in FY24 and FY25, years when the economy grew at double digits, with the revenue deficit remaining above ₹ 44,000 crore. A cyclical problem would have eased with growth but it is noteworthy that, this one did not. This tells you that the stress did not dissipate like a cyclical one would, the persistence of it is a clear indication that it reflects of a much graver problem that is a structural failure of fiscal management.
What does that mean in practice? Even in years when Tamil Nadu’s economy was booming, the government was still spending more than it earned. Economic growth alone is not fixing the gap.
What this gap costs in real terms: The FY25 revenue deficit of ₹ 49,279 crore is roughly what it would cost to build 80 new government medical colleges, or fund the annual salaries of 5 lakh school teachers. It is not being spent on any of that. It is covering the accumulated cost of commitments already made.1
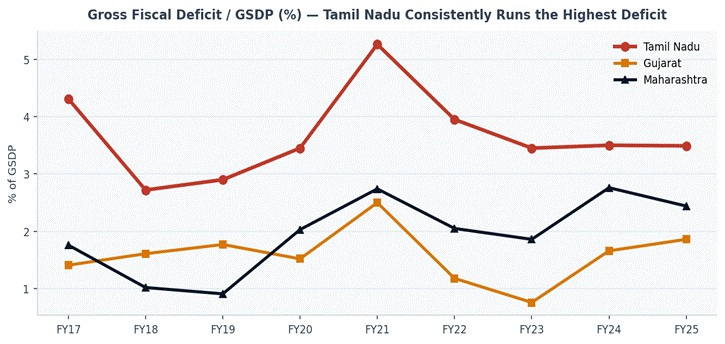
Tamil Nadu’s GFD has averaged 3.5–4.3% of its economy across the period. Gujarat kept its deficit below 2% in most years, touching as low as 0.76% in FY23. Maharashtra stayed between 0.9% and 2.8%. In FY25, Tamil Nadu’s GFD stands at 3.49%, nearly double Maharashtra’s 2.44% and almost twice Gujarat’s 1.86%. The pattern stood the same for about eight consecutive years, that demonstrates the severity of the crisis.
In simple terms: Gujarat and Maharashtra are largely borrowing to build things. Tamil Nadu is borrowing to pay its everyday bills, and then borrowing some more to build things on top of that.
“Tamil Nadu owes ₹ 9.56 lakh crore. That is more than twice what the government spends in an entire year, and it equals roughly ₹ 1.23 lakh for every man, woman, and child in the State.”
Gujarat Often Runs a Revenue Surplus. Tamil Nadu Has Never Come Close.
The revenue deficit is the most revealing fiscal ratio of all that measures whether a state is spending more on day-to-day operations than it earns. A government that persistently runs a revenue deficit is borrowing to pay its current bills, salaries, pensions, operational costs, more than allocating funds to build assets. The peer comparison here is revealing.
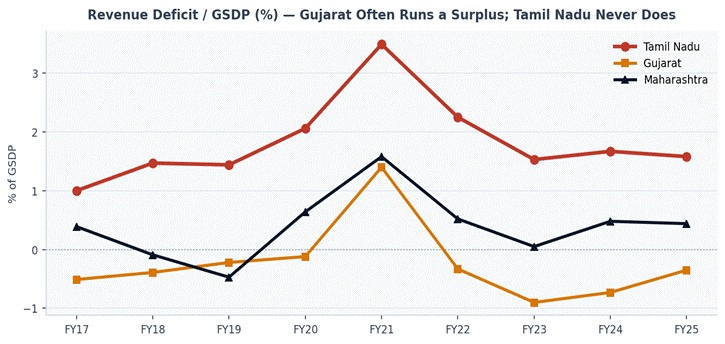
Gujarat ran a revenue surplus in six of the nine years shown, meaning it collected more in routine revenue than it spent on routine operations. Maharashtra’s revenue deficit stayed below 0.64% in most years and averaged around 0.44% in FY25. Tamil Nadu’s revenue deficit has never gone below 1.0% and peaked at 3.49% during COVID. Even in its best post-COVID year (FY23), Tamil Nadu’s revenue deficit was 1.53%, three times Maharashtra’s in the same year. In FY25, Tamil Nadu’s revenue deficit stands at 1.59% of GSDP, compared to a national average of 0.24%2, making it a clear outlier even at the all-India level. This means Tamil Nadu is borrowing to pay for its present akin to investing regularly in high-ticket projects to build for its future.
Here is the simplest way to understand this: Gujarat is a household that earns more than it spends on daily needs and puts aside some savings. Tamil Nadu is a household that borrows every single month just to cover groceries, electricity, and rent - before even thinking about building anything new.
One may argue that the crisis could also be an effect of the COVID-19. But it is noteworthy that the divergence existed before COVID, worsened during it, and has not been corrected since. Tamil Nadu’s routine operations consistently cost more than its routine revenues, and that gap has to be borrowed. Every rupee borrowed to cover this gap will cost ₹ 1.20 or ₹ 1.30 to repay once interest is added. The State is effectively paying tomorrow’s price for today’s running costs.
Every rupee borrowed to cover this gap will cost ₹ 1.20 or ₹ 1.30 to repay once interest is added. The State is effectively paying tomorrow’s price for today’s running costs.
In FY25, Gujarat ran a revenue surplus of 0.35% of its economy. Tamil Nadu ran a revenue deficit of 1.58%. Applied to Tamil Nadu’s GSDP of ₹ 31.2 lakh crore, that difference amounts to roughly ₹ 60,000 crore, the gap between a state that is fiscally self-sustaining on current operations and one that is not.
Gujarat Now Invests 2.71% of Its Economy in Infrastructure. Tamil Nadu Invests 1.53%.
More than 80% of Tamil Nadu’s budget goes to revenue expenditure, salaries, pensions, interest, entitlement transfers. Less than 10% goes to capital outlay: the roads, hospitals, schools, and industrial parks that build future productive capacity. The peer comparison shows not just an absolute shortfall but a direction problem.
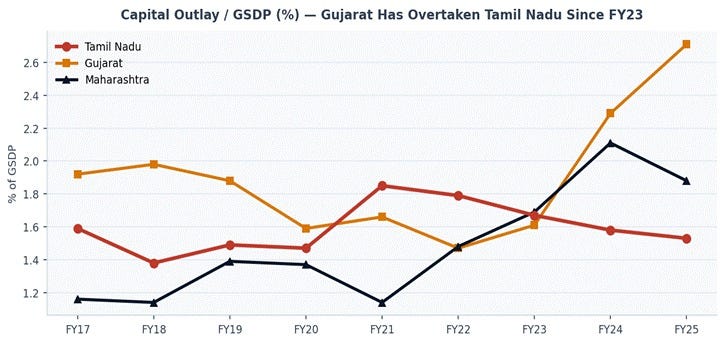
In FY17, Tamil Nadu’s capital outlay at 1.59% of GSDP was below Gujarat’s 1.92% but broadly comparable. By FY25, the gap has become a chasm. Gujarat’s capital outlay has climbed to 2.71% of its economy, a 77% improvement. Tamil Nadu’s has gone in the opposite direction, declining from 1.59% to 1.53%. To match Gujarat’s FY25 capital investment intensity, Tamil Nadu would need to spend roughly ₹ 84,500 crore on infrastructure. It spent ₹ 47,681 crore. The shortfall against Gujarat alone is ₹ 37,000 crore in a single year. The reason is structural: over 80% of the State’s budget is already committed to salaries, pensions, interest payments, and welfare transfers before the first rupee of capital spending is allocated.
What could ₹ 37,000 crore build? Roughly 60 new government hospitals. Or over 1 lakh kilometres of village roads. Or 400 new government colleges. That is the cost, every single year, of falling behind on investment.3
Why is revenue stagnating despite a growing economy? The tax base is structurally narrow. A disproportionate share of collections comes from petroleum products, liquor, and property stamp duties, sources that do not track broad-based economic activity.
When the economy grew 16% in nominal terms in FY25, own-tax buoyancy fell to 0.83, meaning taxes grew slower than the economy itself. That is not a collection problem. It is a structural problem in how the tax system is designed.
Why Growth Isn’t Fixing the Finances: Four Structural Problems
The fiscal data above describes symptoms. The causes run deeper. Tamil Nadu’s economy is growing, but the structure of that growth, who invests, which sectors lead, which districts benefit, how infrastructure is built, determines whether growth translates into fiscal capacity. In four dimensions, the structure is working against the State’s finances.
STRUCTURAL DRIVER 1: INVESTMENT MOMENTUM, LOSING GROUND TO COMPETITORS
Tamil Nadu’s investment narrative is built on headline wins, the Apple ecosystem, the automotive corridor, and a string of global MoUs. But the headline story and the data story are diverging. On the metrics that matter most, FDI inflows, GST growth momentum, manufacturing value capture, Tamil Nadu is losing ground to states competing harder for the same capital.
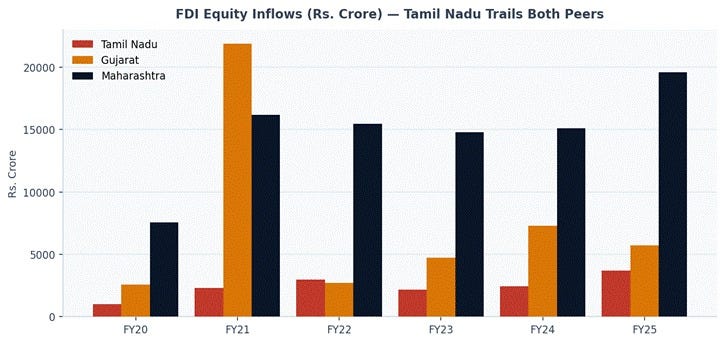
Tamil Nadu’s FDI inflows have been essentially flat since FY20, moving between ₹ 1,000 and ₹ 3,700 crore. Maharashtra pulled in ₹ 19,589 crore in FY25 alone, more than five times Tamil Nadu’s figure. Even excluding Maharashtra’s scale advantage, Tamil Nadu is not accelerating its share of incoming foreign capital.
Foreign investment matters because it creates jobs without requiring the government to borrow. Every factory that a foreign company builds in Tamil Nadu is a source of employment, wages, and taxes, without adding a single rupee to the State’s debt. Flat FDI means Tamil Nadu is missing out on that engine of growth.
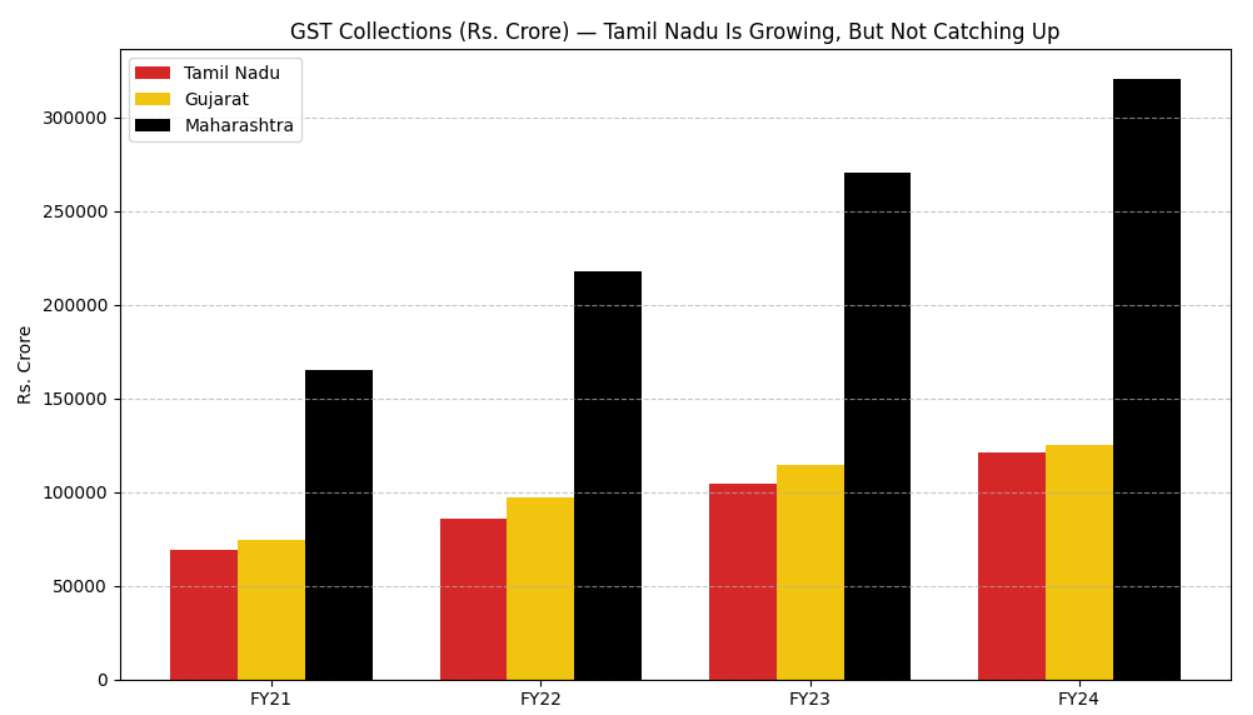
The fiscal implication: Growth driven primarily by public capital formation raises borrowing requirements without generating a self-sustaining private investment cycle. Tamil Nadu’s capital formation has been increasingly state-led, which is why debt grows even as the economy does.
STRUCTURAL DRIVER 2: THE MANUFACTURING VALUE GAP
Tamil Nadu has historically been India’s manufacturing heartland. It still is, by some measures. But the ASI data for 2023-24 reveals a structural problem that investment summit press releases do not mention: Tamil Nadu has a disproportionately large share of India’s factories and workers, but a disproportionately small share of its output and value added.
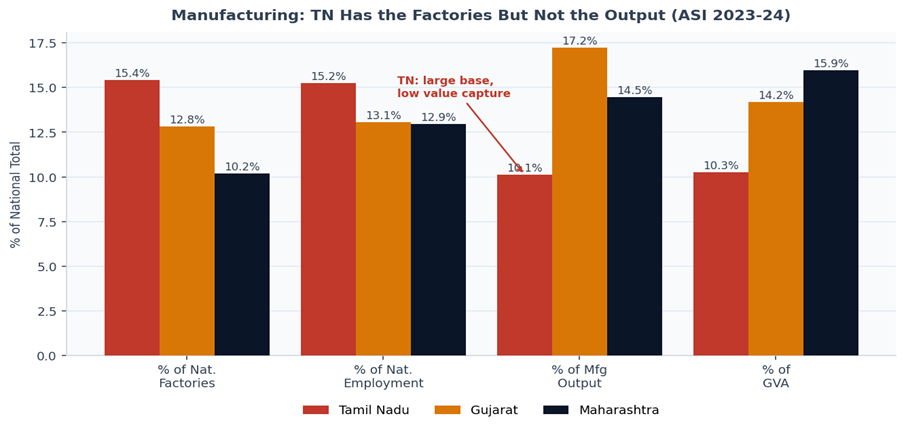
Tamil Nadu runs 15.43% of India’s factories and employs 15.24% of its industrial workforce. But it produces only 10.11% of national manufacturing output and 10.26% of GVA. Gujarat, with fewer factories and workers, produces 17.22% of national output and 14.20% of GVA. Maharashtra shows a similar pattern. Tamil Nadu has scale without productivity intensity, its manufacturing base is concentrated in labour-intensive, lower-value segments rather than the capital-intensive, high-value processing that drives Gujarat’s disproportionate output share.
The fiscal implication: Gujarat’s manufacturing generates roughly 70% more output per factory than Tamil Nadu’s. This gap in value capture translates directly into weaker GST collections, lower corporate earnings, and lower wage income per worker. Tamil Nadu has the factories and the workforce, but not the fiscal returns that should come with them.
STRUCTURAL DRIVER 3: INFRASTRUCTURE EXECUTION FAILURES
Tamil Nadu’s infrastructure problem is not a funding problem. Central allocations are available. The constraint is execution at the state level, and the fiscal cost of that execution failure falls entirely on the State’s own balance sheet.
Tamil Nadu borrows heavily to fund infrastructure. That borrowing creates immediate interest obligations and the productivity returns that would justify the debt are supposed to materialise over time. The problem is that a significant share of that infrastructure is being built slowly, incompletely, or not at all.
This pattern is visible across sectors. NH-48, the Chennai–Vellore highway, has received over ₹ 1,500 crore in central allocation and has been under construction for thirteen years. It remains incomplete. As of early 2026, Tamil Nadu had acquired only 24% of the land required for ongoing railway projects, despite the Ministry of Railways repeatedly flagging the need for faster State-level land procurement. Central funding is available. State-level execution is the constraint.
The same dynamic is most visible in the power sector. TANGEDCO represents a fiscal drain that combines infrastructure failure with governance failure. Between FY20 and FY25, the State transferred ₹ 73,821 crore to TANGEDCO to cover operational losses and tariff gaps. Despite this, the CAG’s 2024 report found TANGEDCO’s loan liability had reached ₹ 1.35 lakh crore. The UDAY restructuring had seen its debt rise 52% in five years. Tariff reform was not implemented. The structural causes of losses were not addressed. Here, borrowing is not just delayed in delivering returns, it is financing assets that continue to generate losses.
The compound effect: Borrowed money is being used to fund infrastructure that either takes too long to become productive (highways, railways) or that actively loses money once built (TANGEDCO). The interest cost accrues immediately. The productive return either arrives late or does not arrive at all.
STRUCTURAL DRIVER 4: SPATIAL INEQUALITY, 8 DISTRICTS CARRY EVERYTHING
Tamil Nadu’s growth is real, but its fiscal base is narrow. The State’s economic activity, and therefore tax generation, is concentrated in a small number of industrial and urban districts. This concentration matters not just for inequality, but for how the State earns and spends.
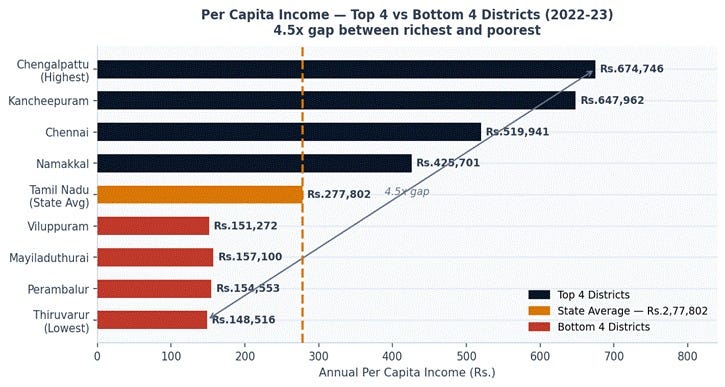
Chengalpattu records a per capita income of ₹ 6.75 lakh per year. Thiruvarur records ₹ 1.49 lakh. The richest district earns 4.5 times more per person than the poorest. Only 8 of the State’s 38 districts exceed the State average. The remaining 30 are below it. This means that a disproportionate share of income, consumption, and tax revenue is generated in a handful of districts.
But expenditure does not follow this geography. Welfare commitments, healthcare, transport, pensions, and social transfers operate across all 38 districts. The State is therefore required to spend broadly, even though it earns narrowly. Unlike revenue, which rises with economic concentration, welfare spending is designed to be universal and counter-cyclical, expanding precisely in regions where income and tax capacity are weakest. This means that as the State pushes for broader inclusion, expenditure obligations increase in districts that contribute the least to the tax base. Over time, this creates a structural pressure on the budget, where incremental spending is not matched by incremental revenue. As welfare commitments expand, this mismatch becomes more binding, locking the State into a cycle of rising expenditure without a commensurate expansion in its fiscal base.
The fiscal implication: Spatial concentration is not just a social problem. It is a fiscal architecture problem. A state that generates the bulk of its tax revenue from 8 districts while funding social sector programmes in 38 districts has built structural deficit pressure into its geography.
Growth Alone Will Not Fix This. It Hasn’t for Eight Years
The most persistent, and most dangerous, assumption in Tamil Nadu’s policy discourse is that fiscal health will follow economic growth automatically. The data of the last eight years is a direct refutation of this assumption.
Tamil Nadu’s real GSDP grew more than 65% between FY17 and FY25. Exports doubled. Industrial investment flowed in. And yet the revenue deficit is higher today than it was eight years ago. The gross fiscal deficit has stayed persistently above 3.4% of GSDP. Capital investment as a share of the economy has fallen. Own revenue mobilisation has stagnated. Growth is happening, but it is not paying for itself.
Growth cannot fix this because the problem is structural. Revenue does not grow with the economy because the tax base is narrow and weakly responsive to aggregate economic expansion. Expenditure does not ease with growth because revenue commitments are politically entrenched. Debt does not stabilise because new borrowing is required every year, and TANGEDCO’s liability adds to fiscal exposure without appearing on the headline debt figures.
If this continues, more and more of the State’s money will go into paying past debt, and less into building roads, hospitals, and schools. The government will keep running its programmes, but it will have less room each year to invest in things that improve people’s daily lives. Projects will move slower, new infrastructure will be delayed, and the gap between what the State needs to build and what it can afford to build will keep widening. Over time, the system will become harder to sustain, with rising debt but fewer visible improvements on the ground. The State will not collapse, but it will steadily fall behind.
Data sources: RBI Handbook of Statistics on Indian States (2024 edition). Peer state ratios for Gujarat and Maharashtra compiled from RBI Handbook data. Tamil Nadu State Planning Commission Economic Survey 2024–25 for district-level income data. ASI 2023-24 (PIB release) for manufacturing output shares. Ministry of Commerce parliamentary question data for FDI inflows. Government of India GST portal for state-wise GST collections. Finance Commission Evaluation Study on Tamil Nadu (2023).
A new medical college requires a 300+ bed teaching hospital and academic infrastructure. Recent cost benchmarks suggest total project costs of ~₹ 500–700 crore per institution (NMC norms). At ~₹ 600 crore per college, ₹ 49,279 crore would finance ~80 colleges . Under the 7th Pay Commission, government school teachers typically earn ₹ 6–10 lakh annually (including allowances) (Bajaj Finance) . At ~₹ 10 lakh per year, ₹ 49,279 crore would cover salaries for ~5 lakh teachers. These are indicative estimates for illustration.
The national average is calculated by aggregating revenue deficit and GSDP across all States and Union Territories and then computing the ratio (∑ Revenue Deficit ÷ ∑ GSDP), rather than taking a simple average of state-level ratios.
Estimates are illustrative. A government hospital is assumed at ~₹500–700 crore per project.Rural road costs vary by specification, with basic rural roads costing ₹10–50 lakh per km. A mid-range estimate of ~₹30 lakh per km is used here, implying ~1.2 lakh km of roads for ₹37,000 crore (DMC Education).For government colleges, (CPWD) benchmarks indicate construction costs of ₹2,000–3,400 per sq ft for educational buildings, with total project costs rising to ~₹3,000–5,500 per sq ft after including services and infrastructure. For a typical 1–1.5 lakh sq ft campus, this implies ~₹50–100 crore per college.