
I. Introduction: The Paradox At The Heart Of The Communist Welfare State
Kerala is celebrated as a model state with a 95.3% literacy rate and exceptional social indicators. However, its success relies heavily on external support. In 2023, remittances from Malayalis working abroad reached ₹ 1.95 lakh crore, accounting for 17% of GSDP and propping up household spending. Despite this, state finances are failing. Between 2016 and 2025, Kerala’s fiscal position weakened as revenues failed to cover mounting expenditure. The economy, driven by services and remittances, cannot generate sufficient government revenue. This structural flaw is aggravated by an ageing population and persistent unemployment, creating a deepening fiscal crisis.
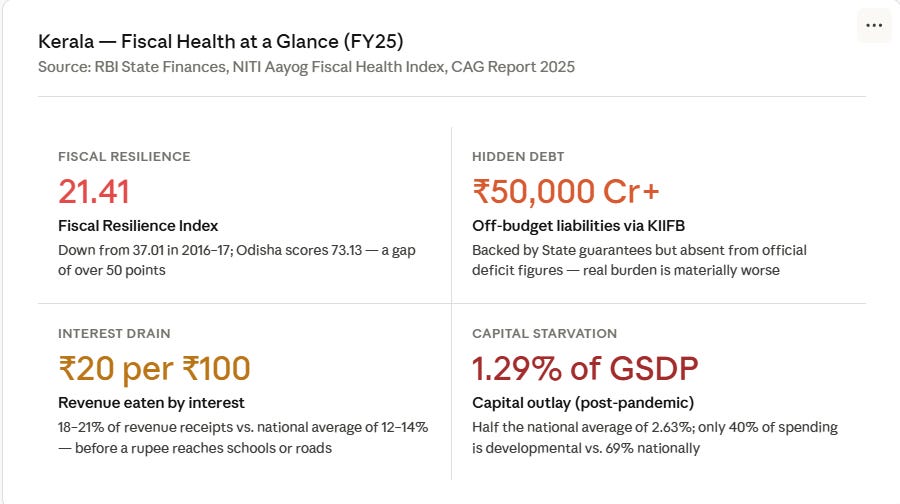
Key Finding: Kerala’s Fiscal Resilience Index has fallen from 37.01 in 2016–17 to 21.41 in 2024–25, with its lowest point during the pandemic. Across most of the key areas assessed, the State has consistently been the weakest performer among the comparator states throughout the period. By 2024–25, the gap is wide, with Kerala’s score far below that of stronger-performing states.
This analysis benchmarks ten fiscal indicators across Kerala, Haryana, and Odisha to isolate the drivers of financial health. The contrast is sharp. While Odisha faces similar economic shocks, it maintains superior fiscal discipline and resource prioritisation. Kerala’s persistent stress is therefore not a structural inevitability but a consequence of specific policy choices regarding resource allocation and debt sustainability.
II. Methodological Framework
This analysis uses a Fiscal Resilience Index based on the NITI Aayog framework. It looks at five areas: quality of spending, revenue generation, fiscal discipline, debt levels, and debt sustainability. Each area is given equal importance, and the indicators within them are also weighted equally.
The index compares Kerala with Haryana and Odisha, which have similar economic size. Data is adjusted over time using a common reference period starting from 2014–15. Actual figures are used to track trends over time, while index scores help compare performance between states and across periods.
III. The Composite Picture: The Collapse Of Fiscal Resilience
The Fiscal Resilience Index reveals a stark divergence. Starting at 37.01 in 2016–17, Kerala has steadily declined, while Odisha climbed from 66.88 to 73.13 over the same period. This widening gap highlights a structural deterioration in Kerala’s fiscal health that persists beyond temporary economic shocks.
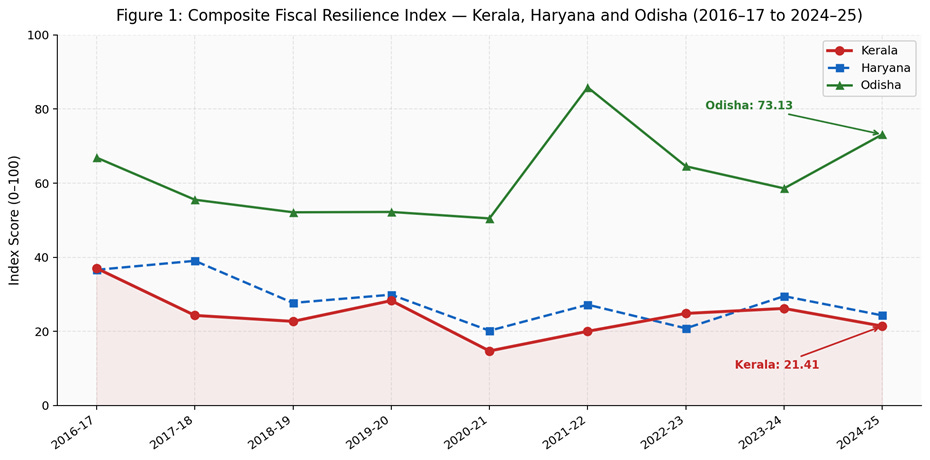
The widening fiscal gap is not a pandemic anomaly, it is a structural failure. Even after recovery, the contrast is stark: in 2022, Odisha scored 64.54, while Kerala languished at 24.83, a gap that widened to over 50 points by 2024. This consistent underperformance, which also trails Haryana, proves the problem isn’t external shocks or the social model’s cost, but deep policy choices.
IV. Quality of Expenditure: Starved Of Investment
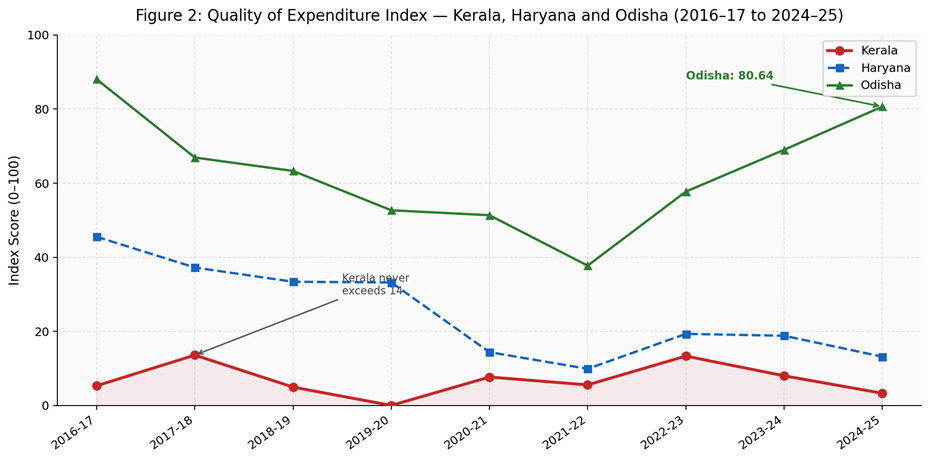
Every year for the past nine years, Kerala has had the lowest score of the three states. This isn’t a one-time thing. It shows that there is a bigger, ongoing problem with how the State spends its money.
The index started at 5.31 in 2016–17, rose briefly to 13.58 in 2017–18, and has since moved up and down without any steady improvement. It had dropped to 3.29 by 2024–25, which was one of its lowest levels. This drop happened during a normal time, without any big shocks like the pandemic or the floods in 2018. That makes it important because it means that the problem is with the way money is spent, not with temporary things.
Looking at the details, Kerala spends much less on capital investment than the national average. In the post-pandemic years, its capital outlay has been about 1.29% of GSDP, compared to 2.63% for India as a whole. Its share of developmental spending is also much lower, at about 40.12% of total expenditure against a national average of 69.74%. These are large gaps that affect long-term growth.
V. Half The Nation's Infrastructure Spend
The share of capital outlay in GSDP shows how much a State is investing in productive assets like infrastructure. At the national level, this has ranged between 2.17% and 2.63% across the three phases studied. Kerala’s figures are much lower. They were 1.21% in Phase 1 from 2016–17 to 2019–20, 1.60% during the pandemic years, and 1.29% in the post-pandemic period. In each phase, Kerala has invested at about half the national rate.
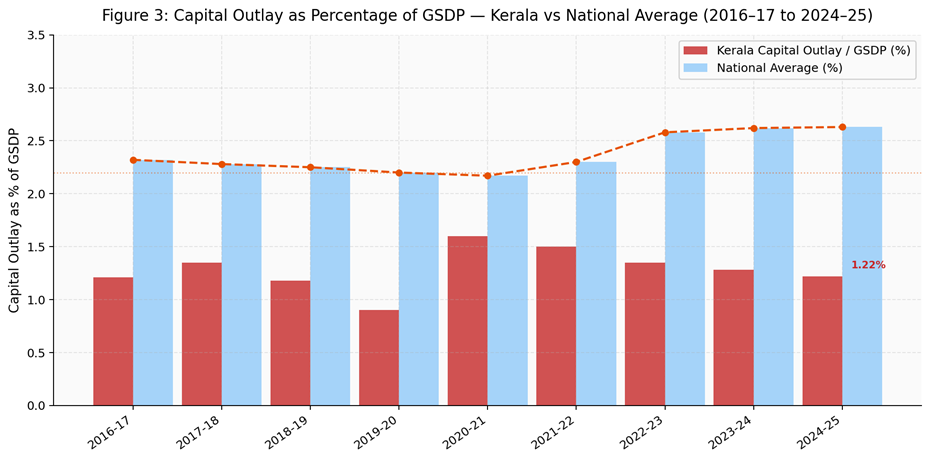
Pandemic-era capital spending actually exceeded post-pandemic levels. This anomaly was driven by infrastructure investment through the Kerala Infrastructure Investment Fund Board, which offset budget cuts. However, rising repayment duties and budget strain have since curtailed this support.
Low capital investment stifles growth by increasing business costs and creating infrastructure gaps. This further restricts the formal sector, limiting tax revenue. Kerala faces acute pressure here due to a tiny manufacturing base, a consumption-heavy economy and heavy reliance on remittances.
VI. Revenue Mobilisation: Revenue That Can't Pay Its Own Bills
Revenue mobilisation is vital: a State must fund its own costs. Kerala’s performance is mixed. Administrative gains, including better GST compliance and the Kerala One portal, boosted its index to 46.56 in 2023–24. However, these improvements face a structural ceiling. While its own revenue is slightly above the national GSDP average, it finances only 23.53% to 29.89% of total expenditure. This dramatically undercuts the national average of 38% to 43%. This severe funding gap forces dependency on transfers or borrowing, directly escalating future repayment burdens.
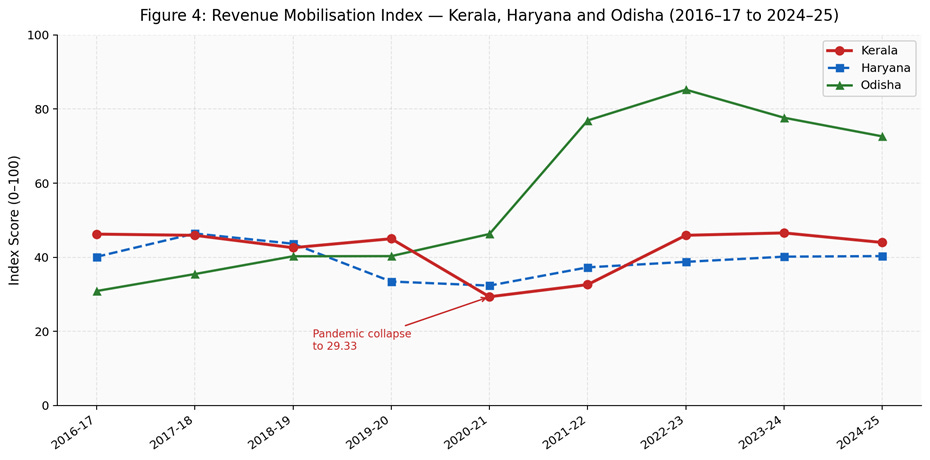
This weakness is linked to the structure of Kerala’s economy. About 67% of its output comes from services such as trade, real estate, and tourism, which are closely tied to consumption. These sectors do not generate strong tax growth. This is reflected in the State’s tax buoyancy, which has averaged about 0.83 over the past decade. In simple terms, when the economy grows, tax revenue grows more slowly. If Kerala had matched the national average in tax buoyancy, its tax collections could have been higher. Over time, this adds up to a significant gap in revenue.
VII. Fiscal Prudence: Breaking The Deficit Rule, Year After Year
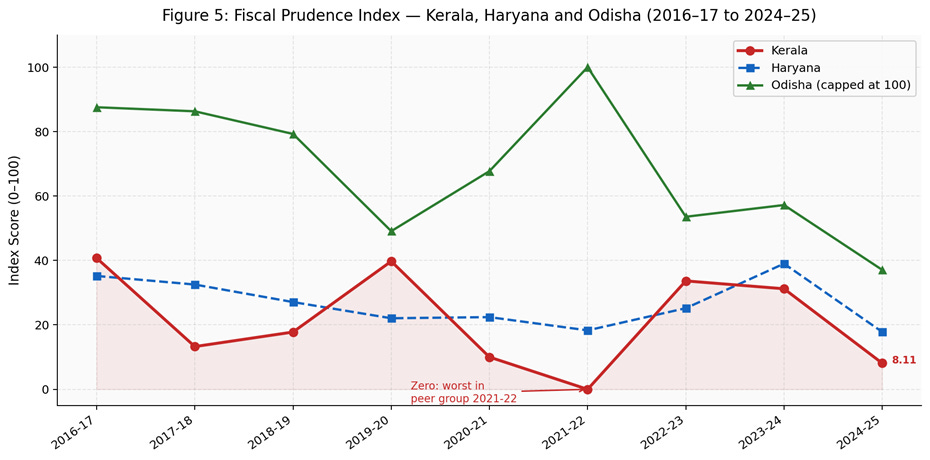
Kerala consistently violates the Fiscal Responsibility and Budget Management (FRBM) Act’s 3% GSDP fiscal deficit limit. The deficit breached this cap repeatedly, from 2017-18 through the pandemic and into recent years. Even when targets were technically met, this was often due to temporary fixes, not structural strength. This failure is evident in the Fiscal Prudence Index, which plummeted from 40.73 in 2016-17 to a nadir of 0.00 in 2021-22. Despite a brief post-pandemic rally, the index again crashed to 8.11 by 2024-25. This persistent cycle of decline confirms the problem is structural: fixed spending commitments remain prohibitively high, unmanageable even in stable economic times.
The revenue deficit gives an even clearer picture. It shows how much the State is borrowing to meet day-to-day expenses instead of investing in assets. Kerala’s revenue deficit has remained much higher than the national average across all phases. This means the State is regularly borrowing to pay for salaries, pensions, and welfare schemes. Over time, this creates pressure on public finances and reduces the space for productive investment.
VIII. Deficit Discipline: A Structural Hole, Not A Pandemic Scar
Chart 6 compares Kerala’s fiscal deficit with the national average and the FRBM limit of 3% of GSDP. The trend is clear. Kerala has crossed this limit in most of the years studied, and even when it has stayed within it, the margin has been small. In 2020–21, the deficit rose to 5.31%, well above the national average of 3.41%. While this was partly due to the pandemic, the more important point is that deficits have remained high even after the recovery. They stood at 3.56% in 2023–24 and are expected to remain at a similar level in 2024–25, while the national average has eased.
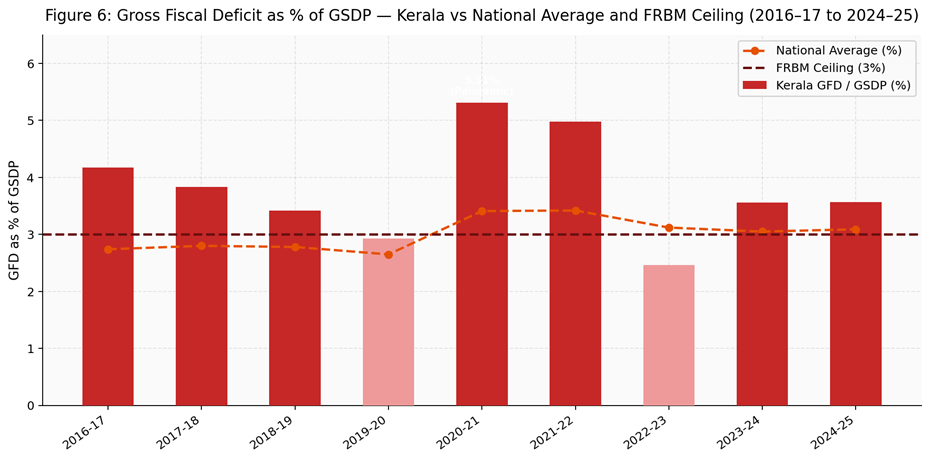
This pattern has long-term consequences. Repeated deficits add to the State’s debt, and higher debt leads to rising interest payments. These payments must be met from a revenue base that is already under strain. Over time, this creates a cycle where borrowing today increases financial pressure tomorrow, making it harder for the State to bring its finances under control.
IX. The Debt Index: Debt Rising. No Bottom In Sight
Among all the indicators, the Debt Index shows the clearest and most consistent trend. It has fallen in seven out of nine years, dropping from 37.26 in 2016–17 to 15.09 in 2024–25. Unlike other measures that show some recovery in certain years, this decline has been steady. It reflects the cumulative effect of repeated deficits, rising interest payments, and the build-up of liabilities over time. Kerala’s debt levels have remained high across all phases, and interest payments alone take up a large share of its revenue, much higher than the national average.
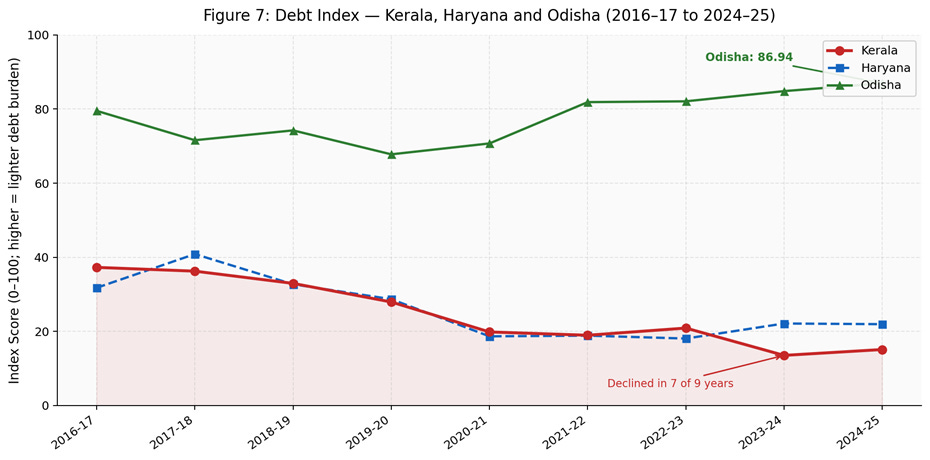
The situation is more serious when off-budget borrowing is included. The Kerala Infrastructure Investment Fund Board has raised over ₹ 50,000 crore through market borrowings backed by State guarantees. These do not fully show up in the official deficit but still add to the State’s obligations. When these are included, Kerala’s effective debt level rises further, and repayment pressures are already becoming visible.
X. The Interest Burden: Revenues Mortgaged Before Allocation
Chart 8 highlights one of the most immediate pressures on Kerala’s finances, the share of revenue used just to pay interest. Nationally, this has been around 12% to 14%, but in Kerala, it has stayed much higher, at about 18% to 21% over the period studied. This means that out of every ₹ 100 the State earns, around ₹ 20 goes straight to interest payments before anything can be spent on services like health, education, or infrastructure. In absolute terms, this translates to more than ₹ 20,000 crore annually in pure debt service. The same sum could fund the complete upgrade of every one of Kerala’s 14 district hospitals to NABH standards and still leave the bulk unspent, or cover the cost of resilient flood drainage and embankment infrastructure roughly six times over, based on the State’s own 2018 disaster reconstruction assessments. It is a recurring bill that leaves no assets behind. Compared to the national average, Kerala is working with significantly less fiscal space from the start, and this has been a steady pattern rather than a temporary issue.
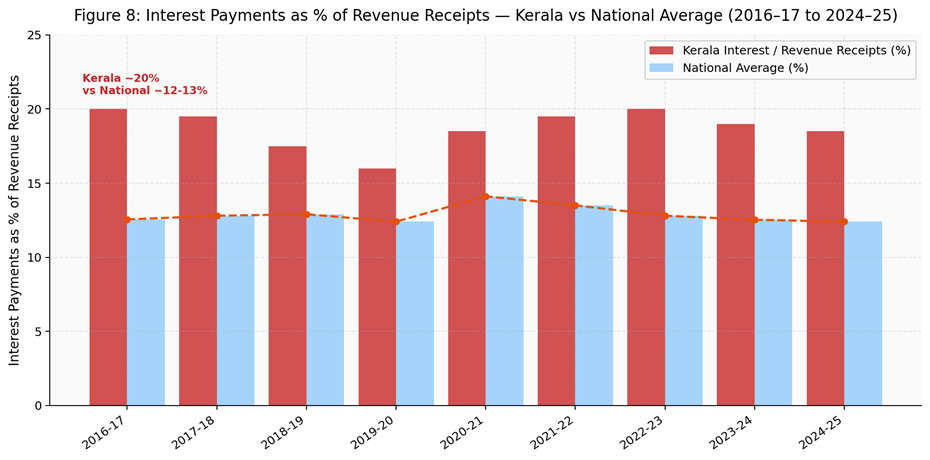
This creates a cycle that is hard to break. High interest payments reduce the money available for other needs, which then forces the State to borrow more. More borrowing leads to even higher interest payments in the future, tightening the pressure further. The situation is made worse by off-budget borrowings, such as those through KIIFB, which add to the real interest burden even if they are not fully reflected in the main figures.
XI. Debt Sustainability: Growing Too Slow to Outrun the Debt
Debt sustainability asks a simple question: Is the economy growing fast enough to keep up with rising debt and interest payments? Kerala’s record here is uneven and fragile. It started strong in 2016–17, with economic growth clearly outpacing interest costs. But this quickly changed. By 2017–18, rising interest payments overtook growth, and the index fell sharply. This pattern of instability has continued over time.
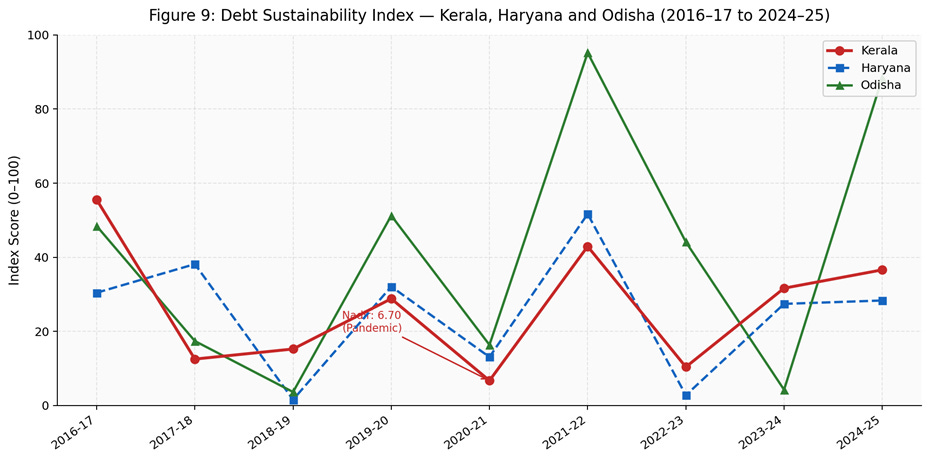
Even after the economy had largely stabilised following the pandemic, the index dropped to a low level. This shows that the problem is not just due to temporary shocks. It reflects a deeper weakness, where debt costs tend to rise faster than the economy in normal conditions. There has been some improvement in the last two years, but this is mainly because interest costs have grown more slowly, not because the economy has grown much faster. This makes the situation vulnerable. In contrast, Odisha’s much stronger position reflects lower debt build-up over time.
XII. An Economy That Keeps Falling Behind
The final chart shifts focus to the economy itself, which underpins the State’s fiscal position. Kerala’s GSDP growth has been lower than the national average in most of the years studied, with only one exception. The gaps have been especially large in certain periods. Growth slowed sharply to 0.90% in 2019–20 compared to 3.87% nationally. The contraction during 2020–21 was deeper than the national fall, and in 2023–24 Kerala grew at 6.73% while India grew at 9.19%. The last of these is particularly important because it came during a period of overall recovery, suggesting that the problem is not temporary.
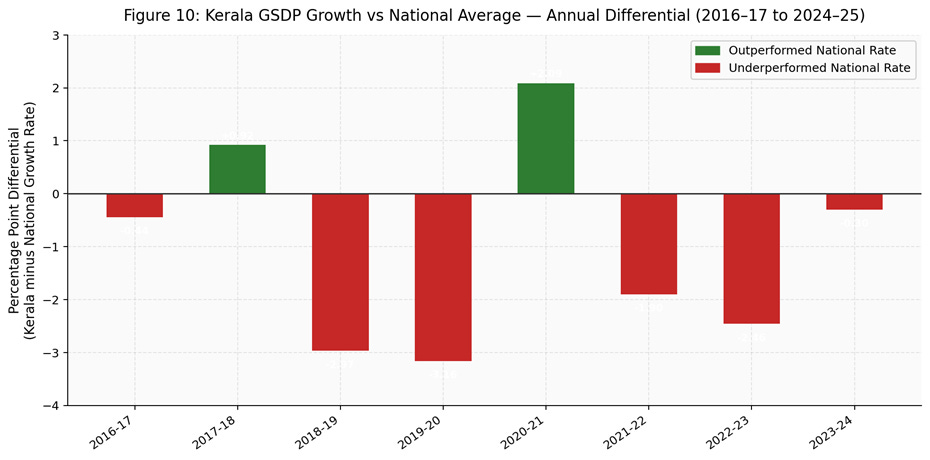
Growth remains volatile, lacking the stability required for sound public finances. This fragility stems from deep structural issues. Remittances and consumption-led services dominate the economy, while manufacturing contributes barely 10% of output. High unemployment among educated youth and an ageing population further constrain the tax base. Kerala consequently struggles to translate its human development success into sustainable economic growth, leaving the budget permanently under strain.
Source: RBI State Finances publications, NITI Aayog Fiscal Health Index methodology (adapted). Index values on a 0-100 scale. Post-pandemic scores (2020-21 onwards) should be read alongside underlying ratio values. 2024-25 values are Budget Estimates.
XII. Conclusion: The Revenue-Rigidity Trap And The Limits Of Incremental Reform
Kerala’s fiscal stress is a chronic structural failure rooted in a fundamental mismatch between revenue and expenditure. Revenue growth remains capped by an economy over-reliant on services and remittances, while inflexible spending on salaries, pensions and public provision programmes continues to climb. This gap is exacerbated by the labour market. Despite high literacy, graduate unemployment is rampant, driving skilled workers abroad and hollowing out the tax base. Consequently, the state fails to translate social development into sustainable economic gains.
These dynamics have fuelled a debt spiral. Borrowing regularly covers daily operational costs, leaving interest payments to consume a significant portion of revenue. Off-budget liabilities further intensify this pressure. With investment in growth-supporting infrastructure sidelined, the State is trapped in a self-reinforcing cycle where high debt stifles the very fiscal space needed for recovery. Reversing this requires Kerala to raise its capital outlay from 1.29% of GSDP closer to the national average of 2.63%, reduce its interest burden from ~20% of revenue receipts to below 15%, and diversify beyond a services-and-remittances economy where manufacturing contributes barely 10% of the output, and has no credible path back.
Also, please consider subscribing to NFPRC Foundation’s focused centres covering latest economic, policy and administrative developments -
Centre for Law, Policy and Governance - Link
Centre for Accelerating India’s Growth - Link
Centre for Studies in Indian Social Systems - Link
NFPRC Foundation - Link
Data Sources and References
Reserve Bank of India. State Finances: A Study of Budgets, multiple years. RBI Publications.
Government of Kerala. (2025). Medium-Term Fiscal Policy Framework 2025-26. Budget Documents.
Fincom India. (2025). Tax buoyancy analysis, Kerala. 16th Finance Commission Study.
The Hindu. (2025). Kerala paradox: 100% literacy but 42% graduate unemployment.
International Institute of Migration and Development. (2024). Kerala Migration Survey 2023.
PRS Legislative Research. (2025). State of State Finances 2025.