

In July 2025, India’s economy continued its expansion, primarily driven by robust domestic demand and near record-low headline inflation. This occurred despite escalating global trade tensions and increasing geopolitical uncertainty. Significant policy achievements include maintaining strong domestic demand while controlling inflation. This performance is particularly noteworthy given global headwinds such as trade tensions, geopolitical uncertainties, and uneven recoveries in major economies.
Multiple positive indicators, from record-low inflation to strong employment gains, suggest that structural reforms and targeted interventions are yielding tangible results. Strong payroll additions and steady formalization indicate a broad-based jobs recovery across various sectors. These signals collectively suggest that supply-side reforms, combined with a well-coordinated fiscal-monetary stance, have effectively contained price pressures without compromising growth.
These metrics provide policymakers with evidence of India’s resilient and adaptable growth model, even amidst mounting external challenges. Therefore, policy should focus on safeguarding real household incomes, sustaining public capital formation momentum, and reducing frictions that hinder exports. Additionally, clearing bottlenecks in credit and factor markets would strengthen buffers against external shocks and maintain the reform-led expansion on a sustainable trajectory
Key Highlights from India’s recent Economic Momentum :
Growth Leadership Sustained: India maintains its position as the world’s fastest-growing major economy with 7.8% GDP growth in Q1 FY2025-26, driven by robust 9.3% services expansion and agricultural recovery to 3.7%.
Inflation at Historic Lows: Consumer price inflation plunged to 1.55% the lowest since June 2017 with food prices entering deflation (-1.76%). This demonstrates effective price management amid global pressures.
Export Diversification Gains Traction: Total exports grew 5.23% to $ 277.63 billion (Apr-Jul 2025), led by electronics surging 33.9% and engineering goods advancing 13.8%, signaling structural competitiveness improvements.
Financial Stability Anchored: Foreign reserves climbed to $ 698.19 billion while RBI maintained policy rates at 5.50%, providing a monetary stability buffer against global volatility.
Fiscal Health Strengthening: GST collections rose 7.5% to ₹ 1.96 lakh crore, direct taxes jumped 13.6%, and capital expenditure allocation increased 10% to ₹11.2 lakh crore, targeting 4.4% fiscal deficit.
Employment Scenario Brightening: Labor force participation reached 54.9% with unemployment declining to 5.2%, indicating improving job market dynamics, particularly in rural areas.
Agricultural Resilience Demonstrated: Kharif crop area expanded by 31.7 lakh hectares with rice cultivation up significantly, reflecting favorable monsoon conditions and policy support.
Clean Energy Targets Exceeded Early: Non-fossil fuel capacity hit 242.8 GW (50.07% of total), surpassing COP26 commitments five years ahead, with solar reaching 116.24 GW.
Manufacturing Momentum Returns: Steel production grew 4.15% while trade deficit narrowed 28%, and cement output surged 11.7%, reflecting robust infrastructure demand and industrial recovery.
Sectoral Confidence Building: Manufacturing PMI touched 16-month high of 59.1, services PMI at 60.5, indicating broad-based business optimism across key economic sectors.
In July 2025, India’s economy entered a phase of balanced and sustainable growth, characterized by stable prices, job creation, and diversified economic activity. The simultaneous achievement of low inflation and strong growth provides policymakers with flexibility for continued structural reforms and targeted investments in infrastructure and human capital.
To sustain this momentum, careful management of monsoon dependencies in agriculture, global supply chain disruptions, and fiscal discipline will be crucial, alongside continued support for growth. These results affirm the current economic strategy, underscoring the ongoing need to prioritize export competitiveness, expand manufacturing, and integrate rural economies to achieve India’s goal of becoming a developed economy by 2047.
I. Economic Snapshot :
This section presents an overview of our economic performance as of July 2025, based on the latest data from the Ministry of Statistics and Programme Implementation (MoSPI), the Reserve Bank of India (RBI), the Ministry of Finance, the Ministry of Commerce and Industry and other relevant Ministries. (Refer To Annexure I For Detailed Analysis)
A. Growth And Output :
Real GDP has been estimated to grow by 7.8% in Q1 of FY 2025-26 over the growth rate of 6.5% during Q1 of FY 2024-25.
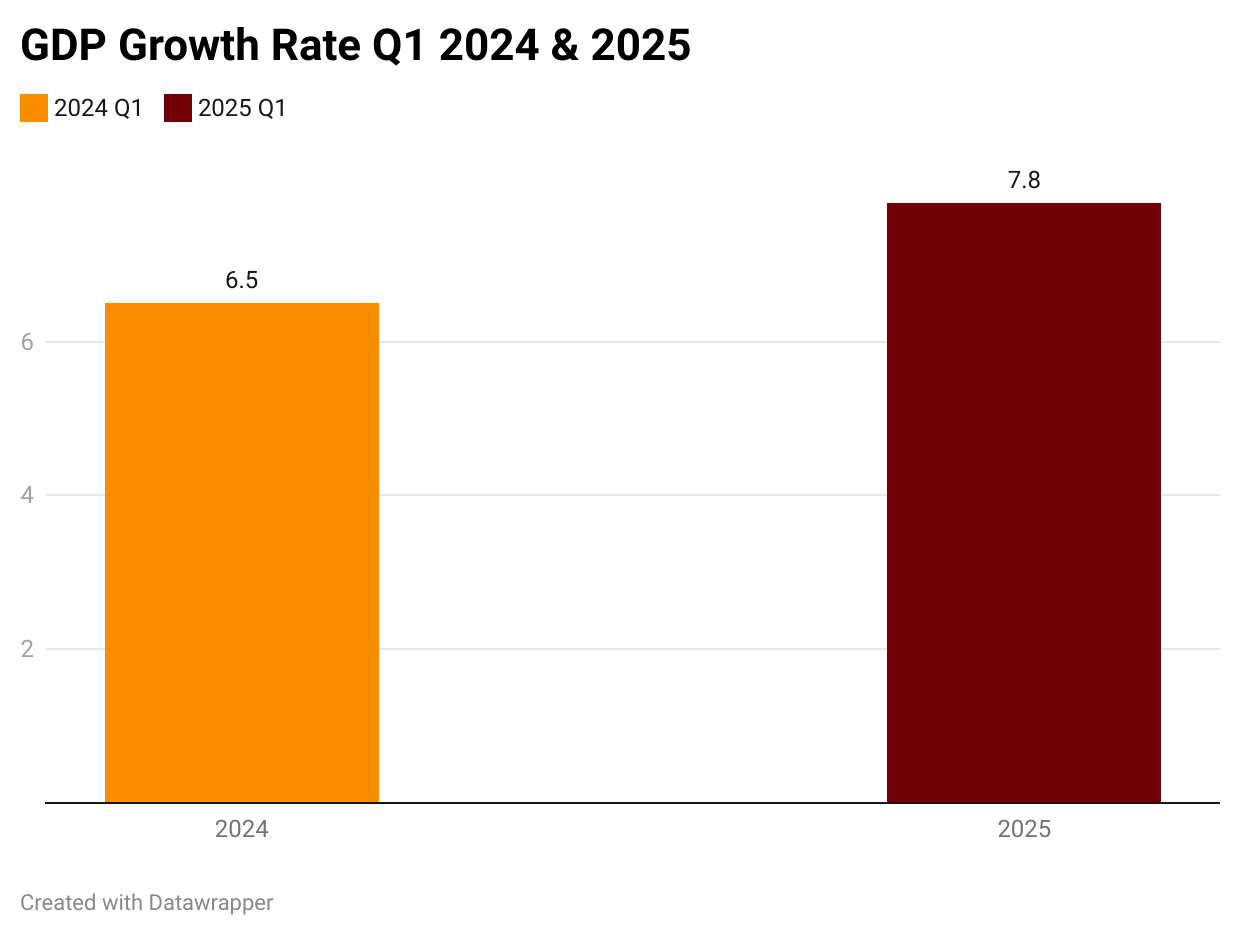
Real GDP or GDP at Constant Prices in Q1 of FY 2025-26 is estimated at ₹ 47.89 lakh crore, against ₹ 44.42 lakh crore in Q1 of FY 2024-25, registering a growth rate of 7.8%. Real GVA in Q1 of FY 2025-26 is estimated at ₹ 44.64 lakh crore, against ₹ 41.47 lakh crore in Q1 of FY 2024-25, registering a growth rate of 7.6%.
India’s Index Of Industrial Production Records Growth Of 3.5% In July 2025
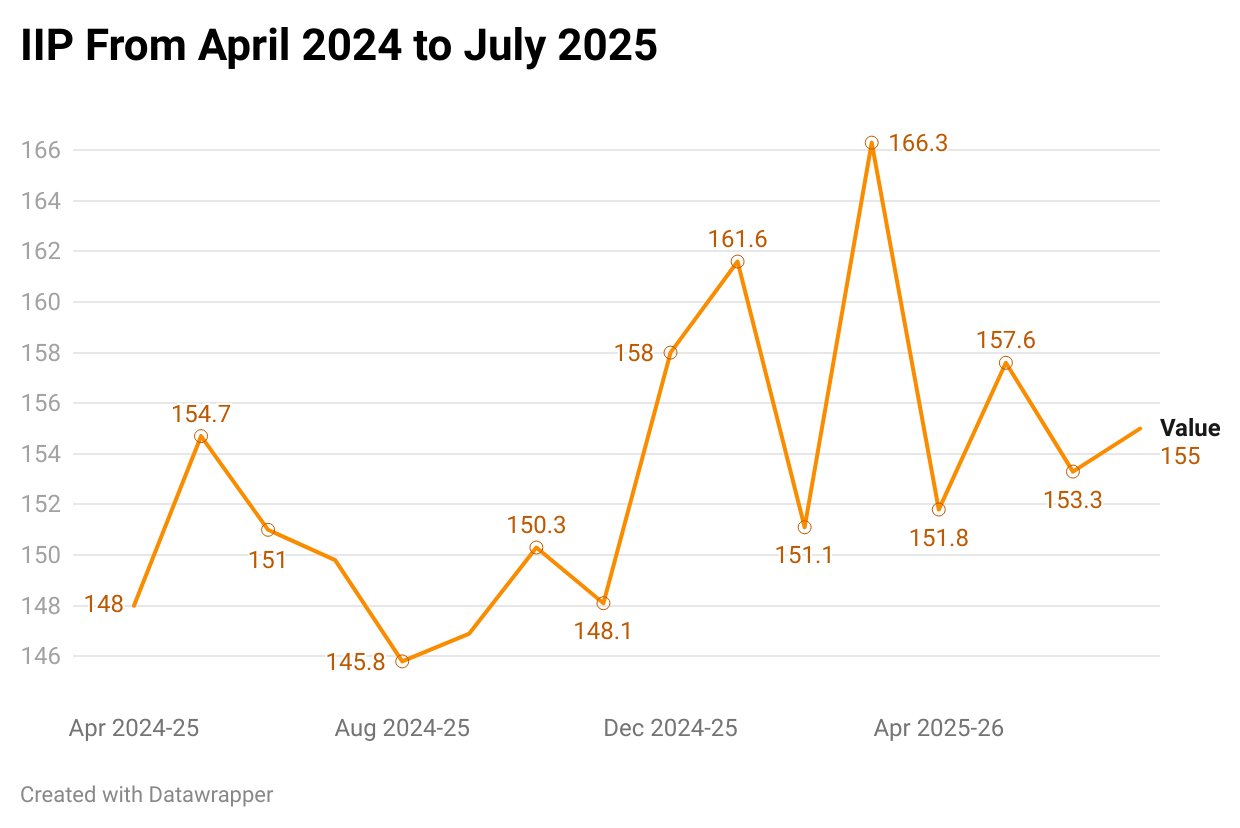
The growth rates of the three sectors, Mining, Manufacturing and Electricity for the month of July 2025 are -7.2%, 5.4% and 0.6% respectively. The Quick Estimates of IIP stands at 155.0 against 149.8 in July 2024. The industrial productivity for July 2025 grew by 3.5% against June 2025’s 1.5%.
B. Inflation and Price :
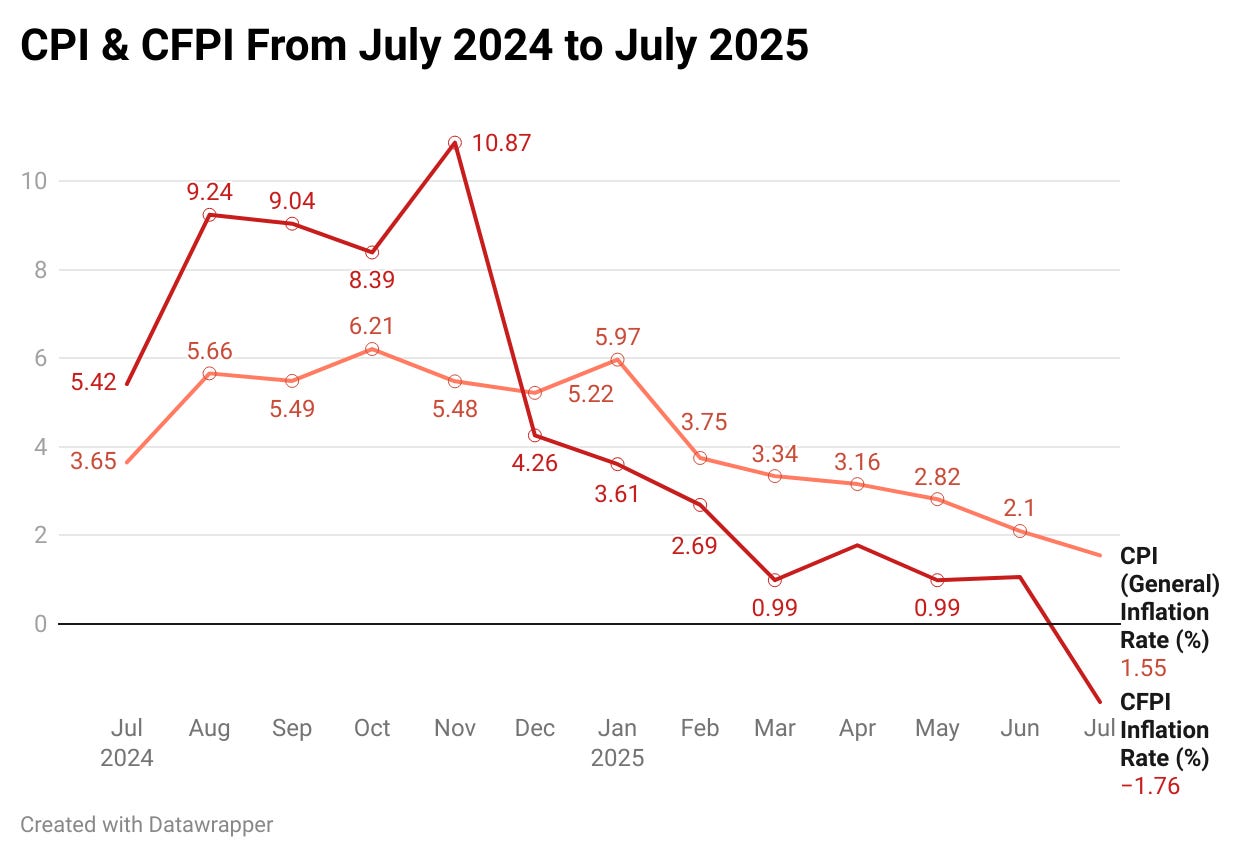
Yearly inflation rate based on All India Consumer Price Index (CPI) for the month of July, 2025 over July, 2024 is 1.55% (Provisional). It is the lowest year-on-year inflation rate after June, 2017. The sharp rise in headline and food inflation comes mainly from the favorable base effect.
C. Trade And External Sector :
The Cumulative Exports (Merchandise And Services) During April-July 2025 Is Estimated At $ 277.63 Billion, As Compared To $ 263.83 Billion In April-July 2024, An Estimated Growth Of 5.23%.
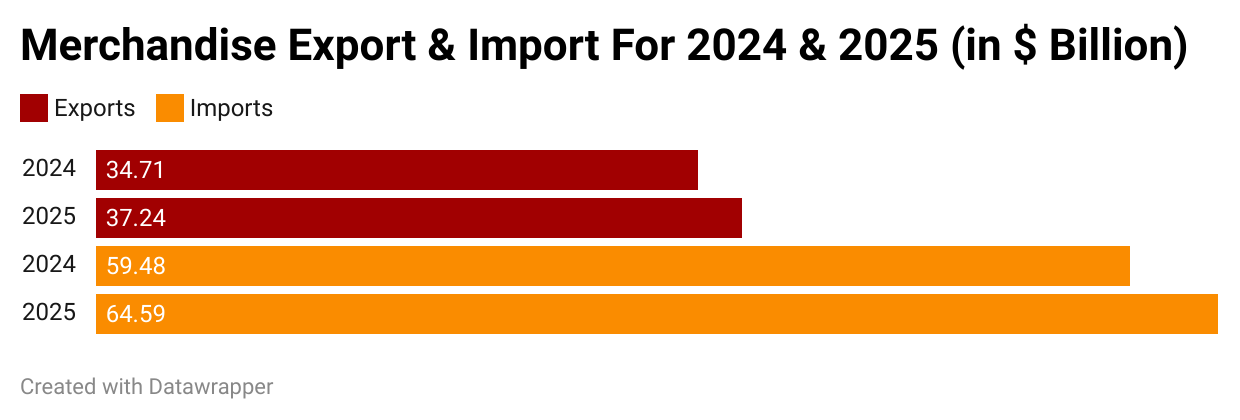
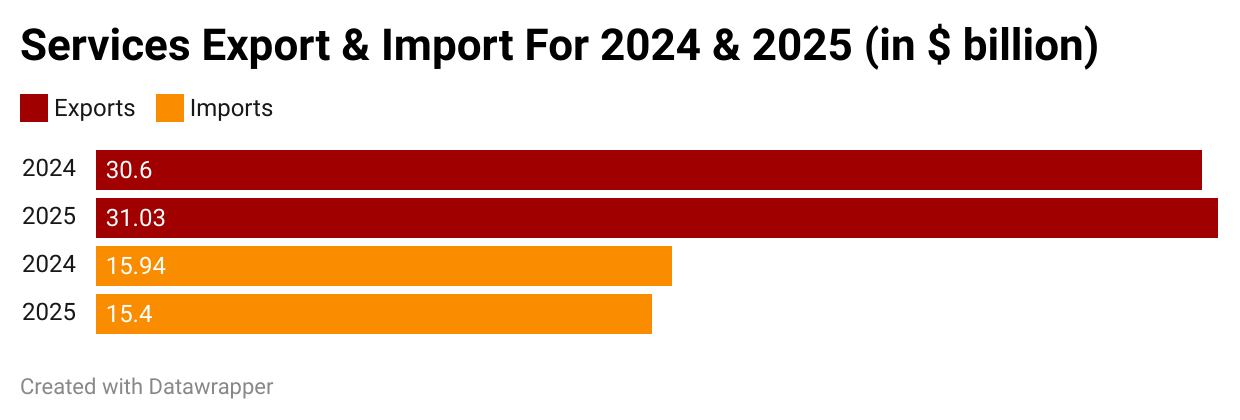
The Estimated Value Of Services Export For July 2025 Is $ 31.03 Billion As Compared To $ 30.60 Billion In July 2024. The Imports For July 2025 Is $ 15.40 Billion As Compared To $ 15.94 Billion In July 2024.
D. Financial Health :
Stable Indian Government Bond Yields Push Investors Towards More Attractive Corporate Debt.
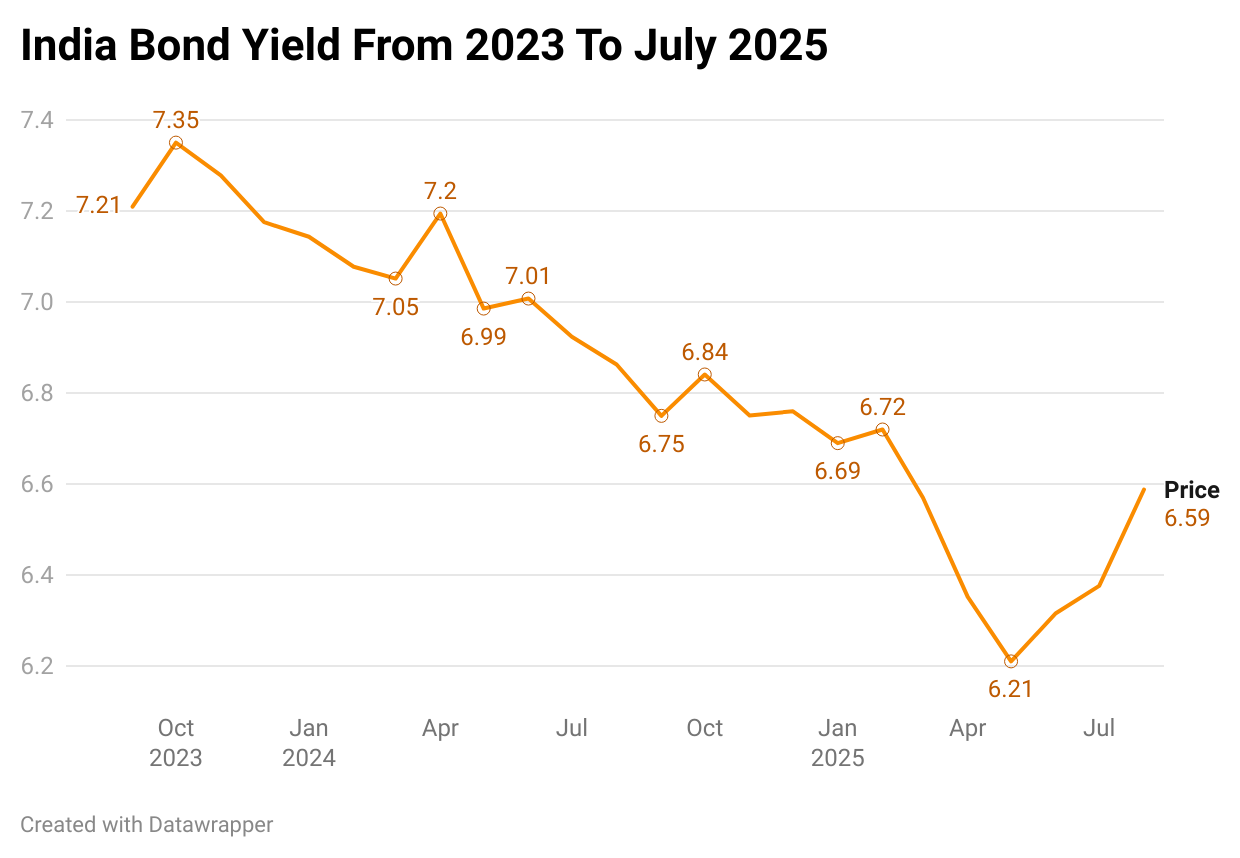
The London Stock Exchange Group data shows that top-rated (AAA) corporate bonds for two and three years give returns of 6.56% and 6.70%. The gap between these corporate bonds and Government bonds has widened by about 20–30 points in the last month, reaching around 85 points.
E. Fiscal Health :
Centre’s July 2025 GST Revenue Up 7.5% To ₹ 1.96 Lakh Crore
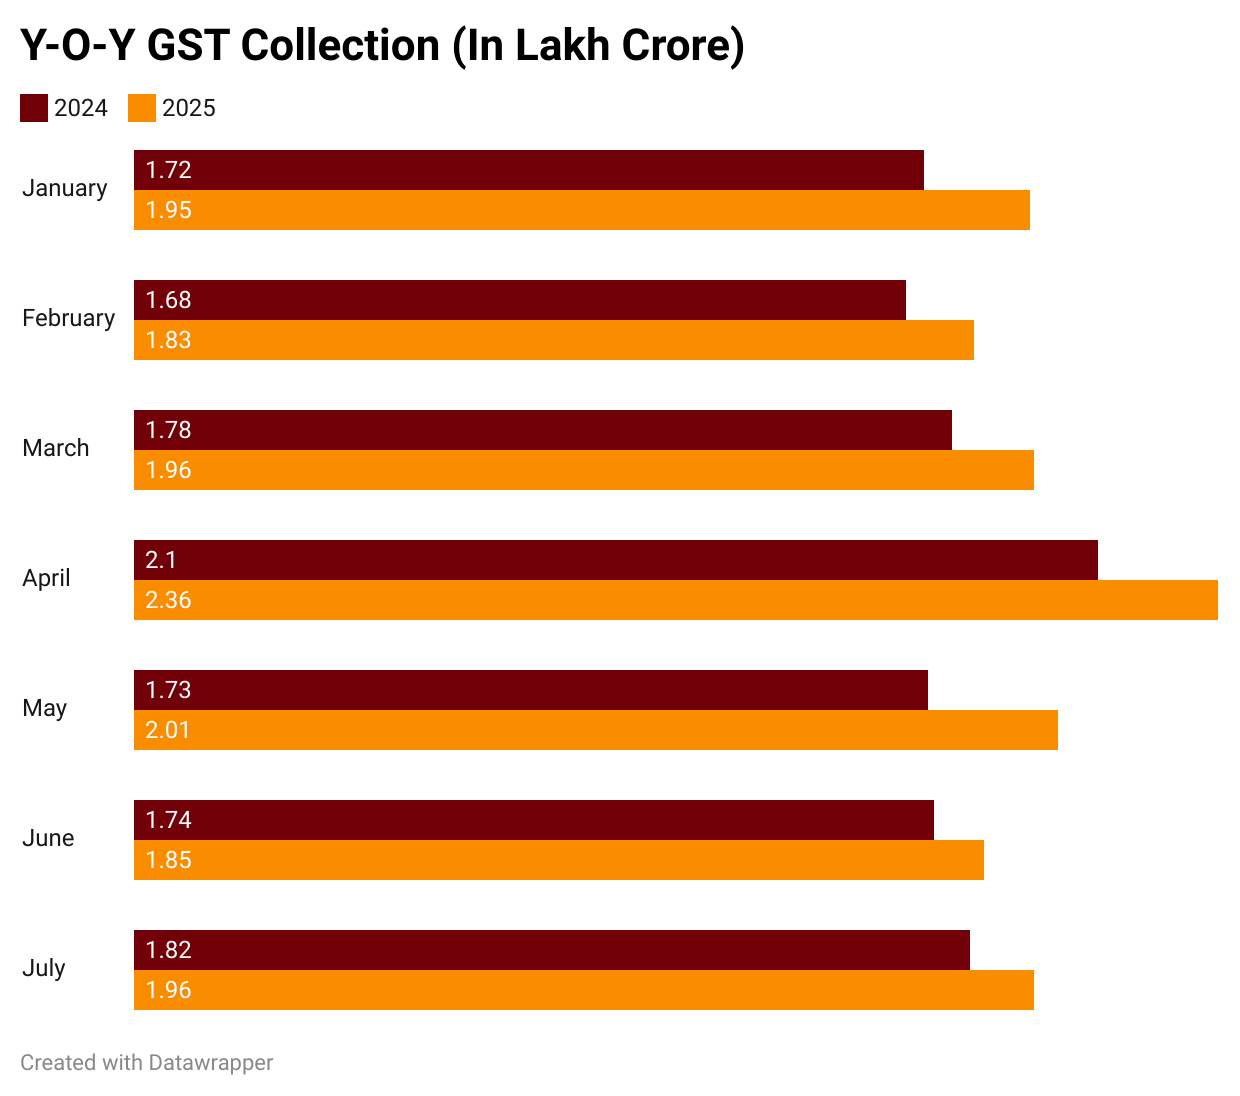
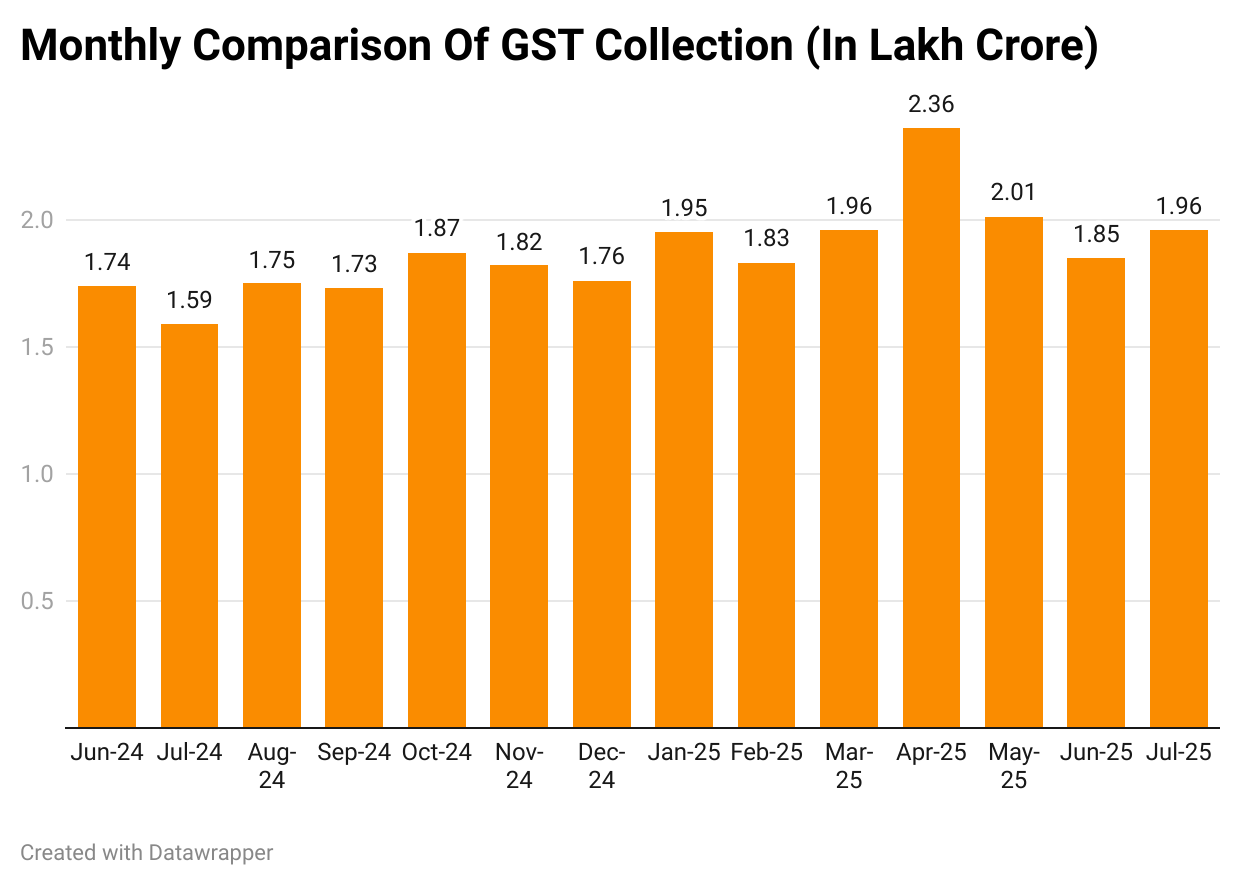
Although GST grew by 7.5% compared to last year, refunds surged by nearly 67% to ₹ 27,147 crore in July 2025 as compared to July last year. Despite higher refunds, the Government’s net GST revenue stood at ₹ 1.7 lakh crore, 1.7% higher than the net amount collected in July 2024.
F. Labour And Employment :
During The Month Of July 2025, Labour Force Participation Rate (LFPR) In Current Weekly Status (CWS) Among Persons Of Age 15 Years And Above Was 54.9% As Compared To 54.2% During June 2025.
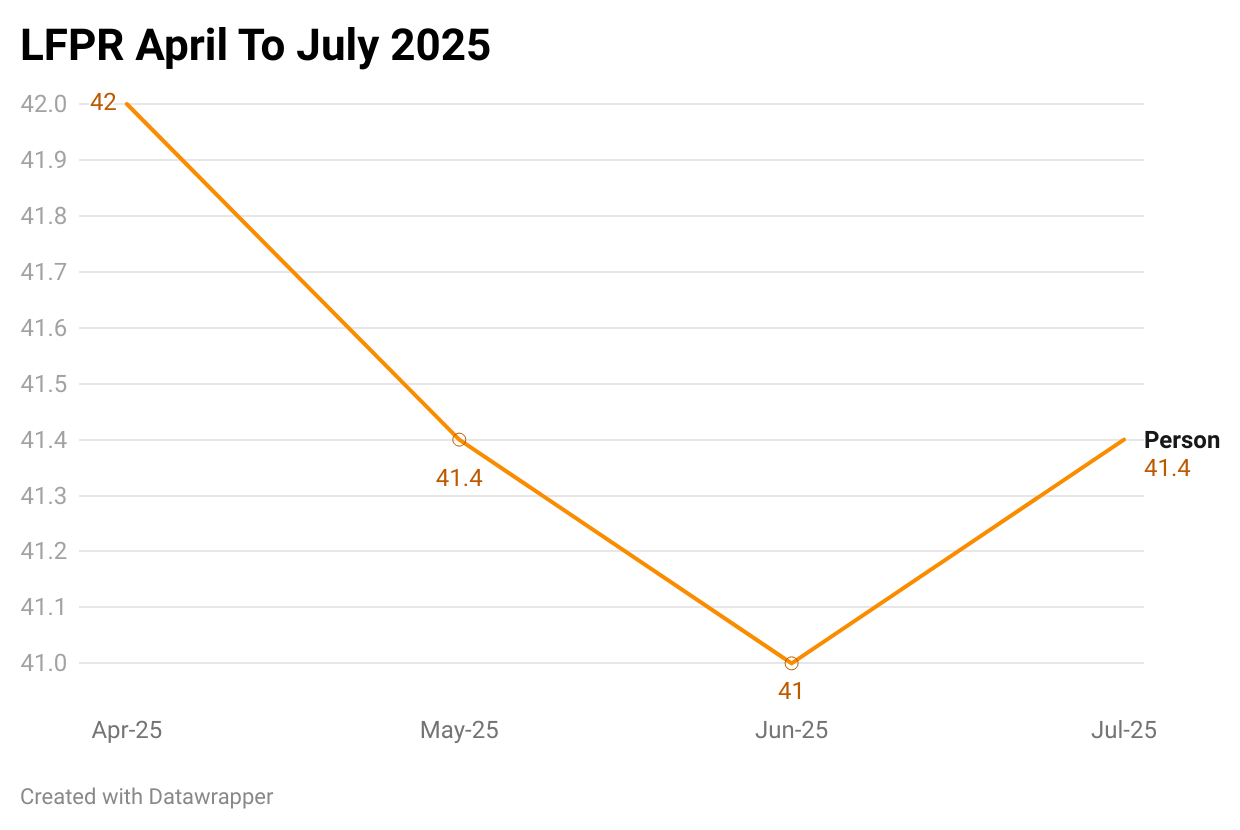
During the month of July 2025, LFPR in CWS among persons of age 15 years and above was 54.9% as compared to 54.2% during June 2025. During July 2025, LFPR in rural areas and urban areas was 56.9% and 50.7%, respectively for persons of the same age group.
II. Sectoral Snapshot :
This section presents an overview of our performance in key sectors as of July 2025, based on the latest data from the Ministry of Commerce And Industries, Ministry of Health, Ministry of Road, Transport and Highways, Ministry of New and Renewable Energy.
A. Agriculture :
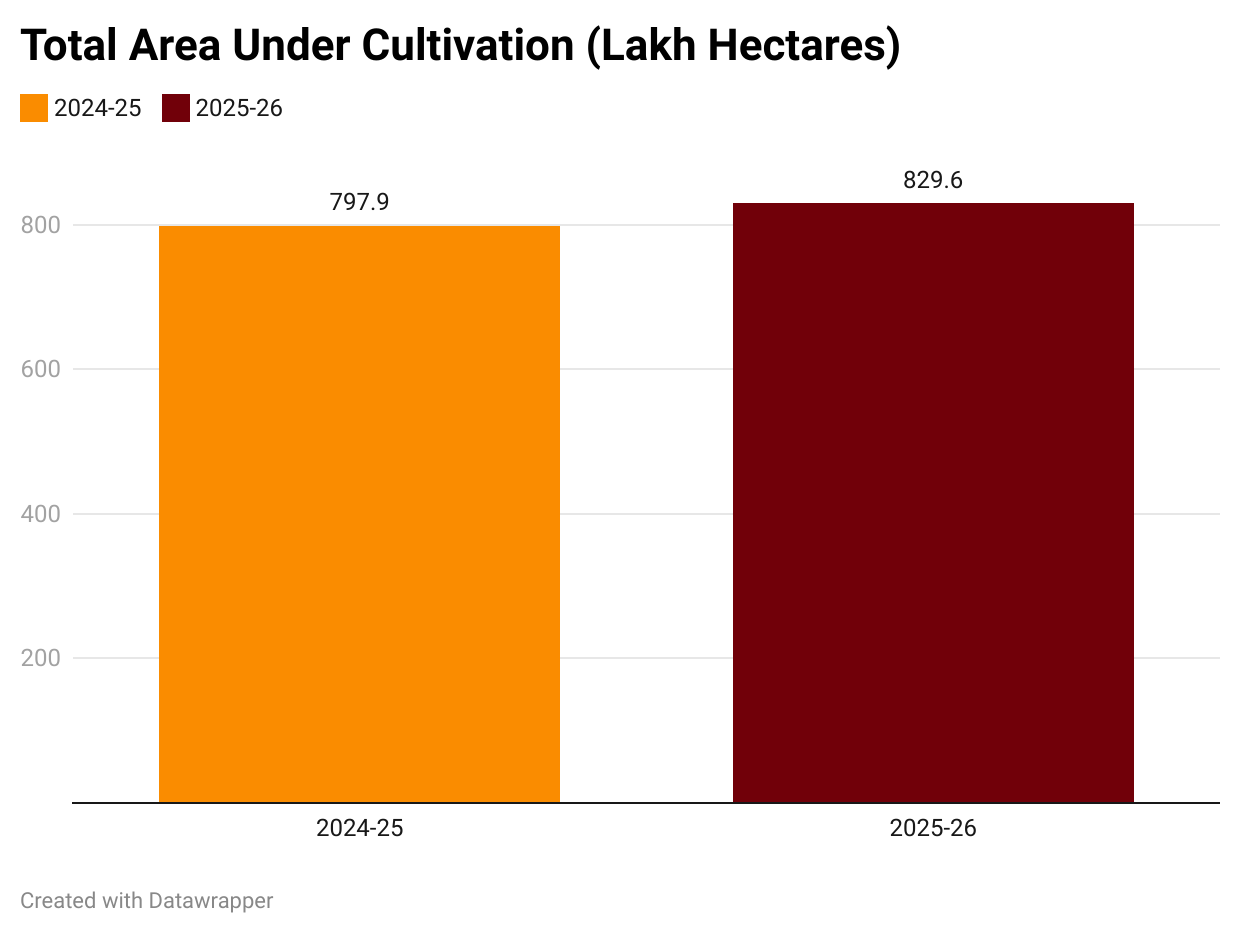
The sowing data for 2025-26 shows a mixed picture across major crops. Rice has seen a good rise compared to last year, with an increase of nearly 29 lakh hectares. Pulses also gained modestly, though the growth is uneven. The sown area in 2025-26 rose by 31.73 lakh hectares compared to last year.
B. Animal Husbandry :
Consumer Price Index (CPI) for Milk Exhibits A Moderate Increase in Milk Prices
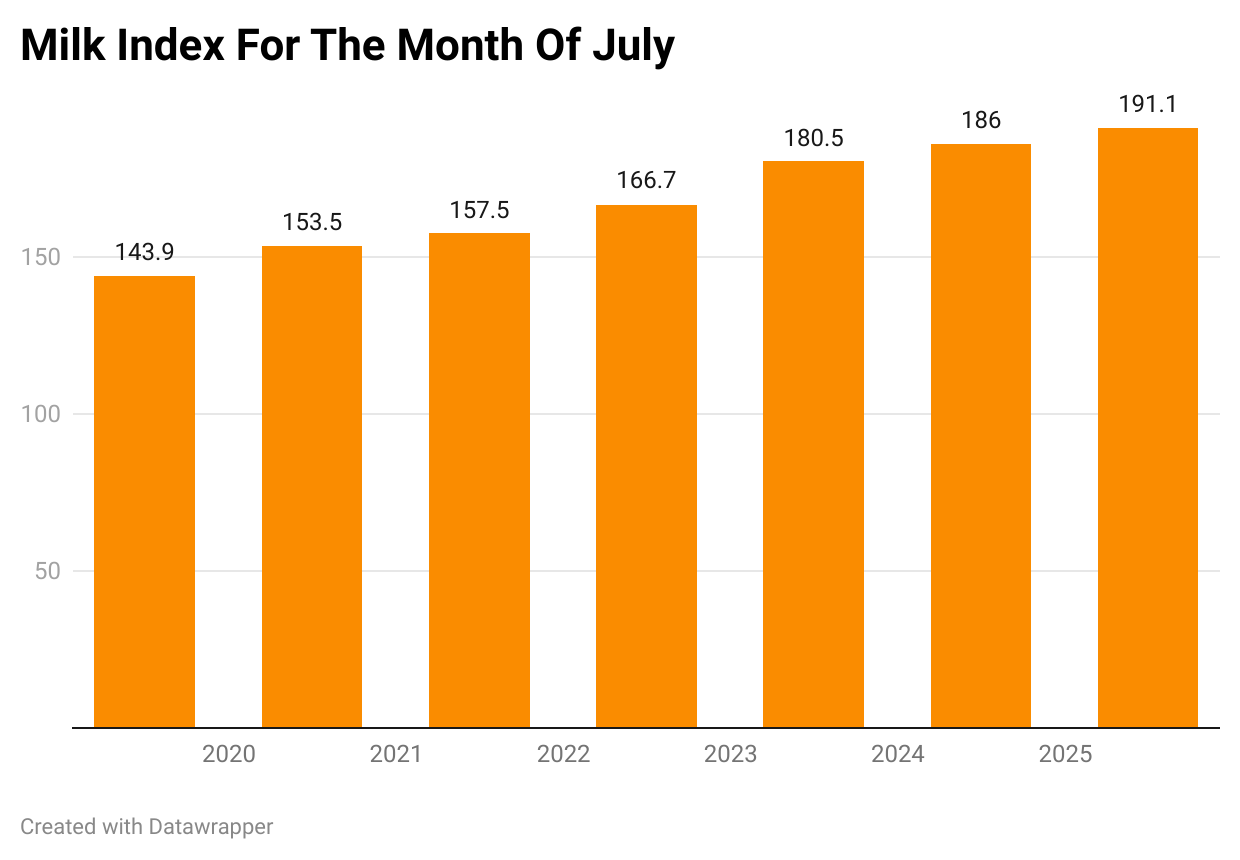
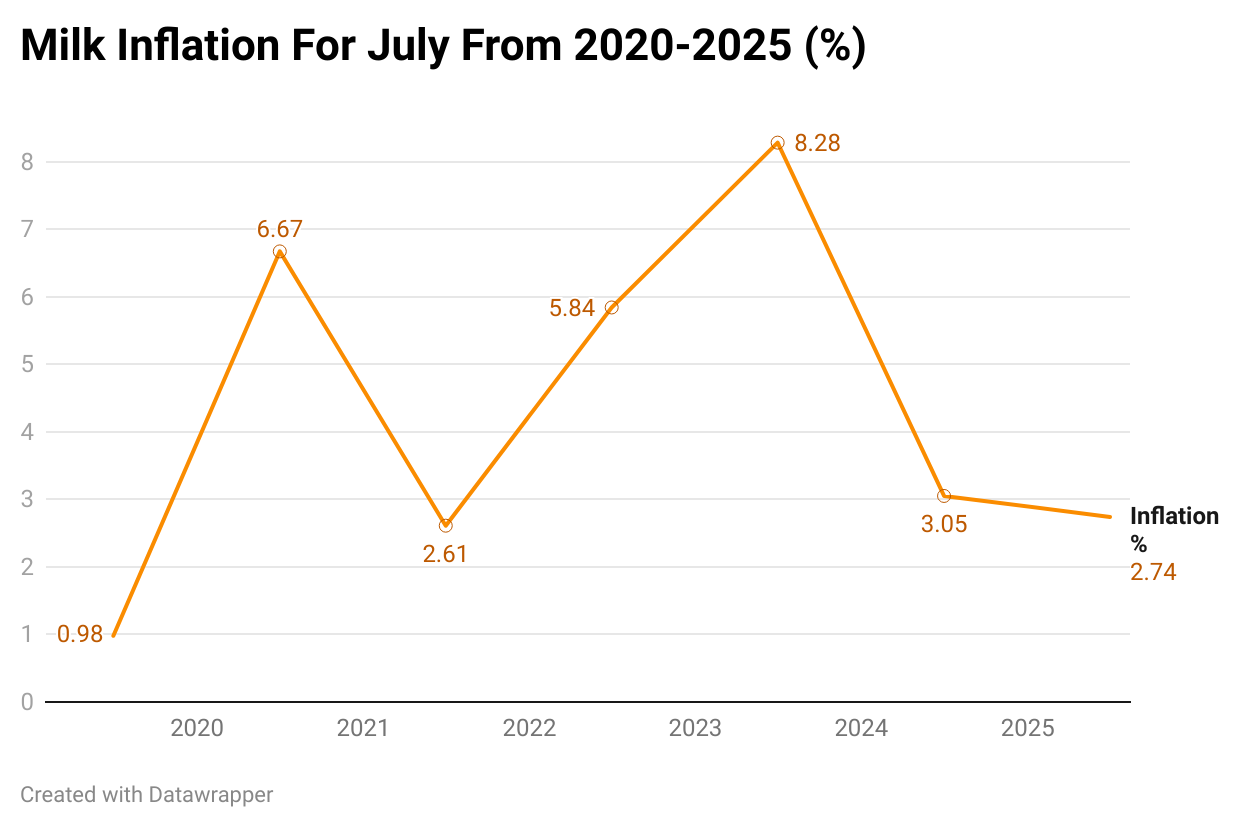
The annual rate of inflation for milk prices as of July 2025 from July 2024 is 2.74%, while it was 3.05% for the same period last year. This indicates a moderate rise in the prices of milk. Furthermore, the milk production in the country has increased by 63.56% during the past 10 years from 146.3 million tonnes in 2014-15 to 239.30 million metric tonnes in 2023-24.
C. Coal :
Coal Production & Despatch Declines For Second Consecutive Month In July, 2025.
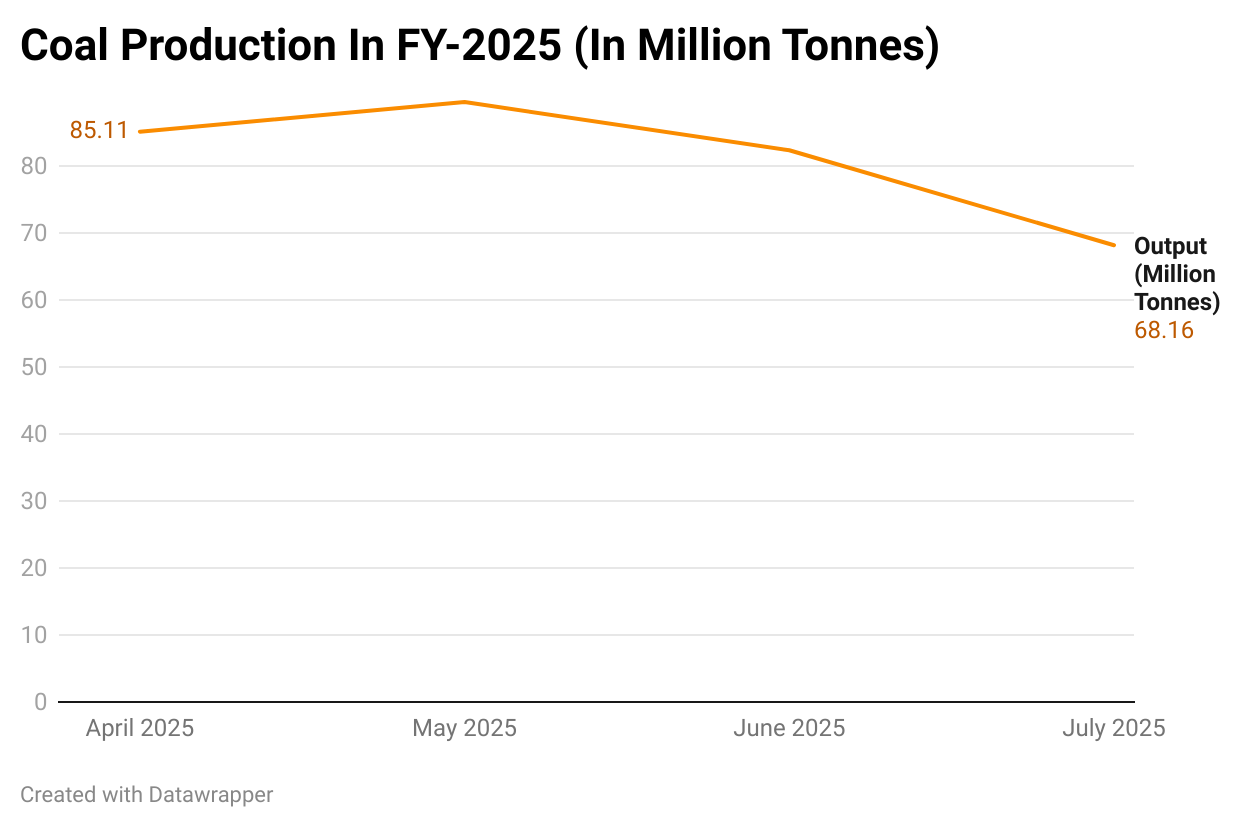
Coal production declined by more than 12% yearly to 64.86 million tonnes (mt) last month. On a monthly basis, the output fell by almost 18%. Coal mining operations enter the slow lane during the four-month monsoon season and pick pace from October to March.
D. Renewable Energy :
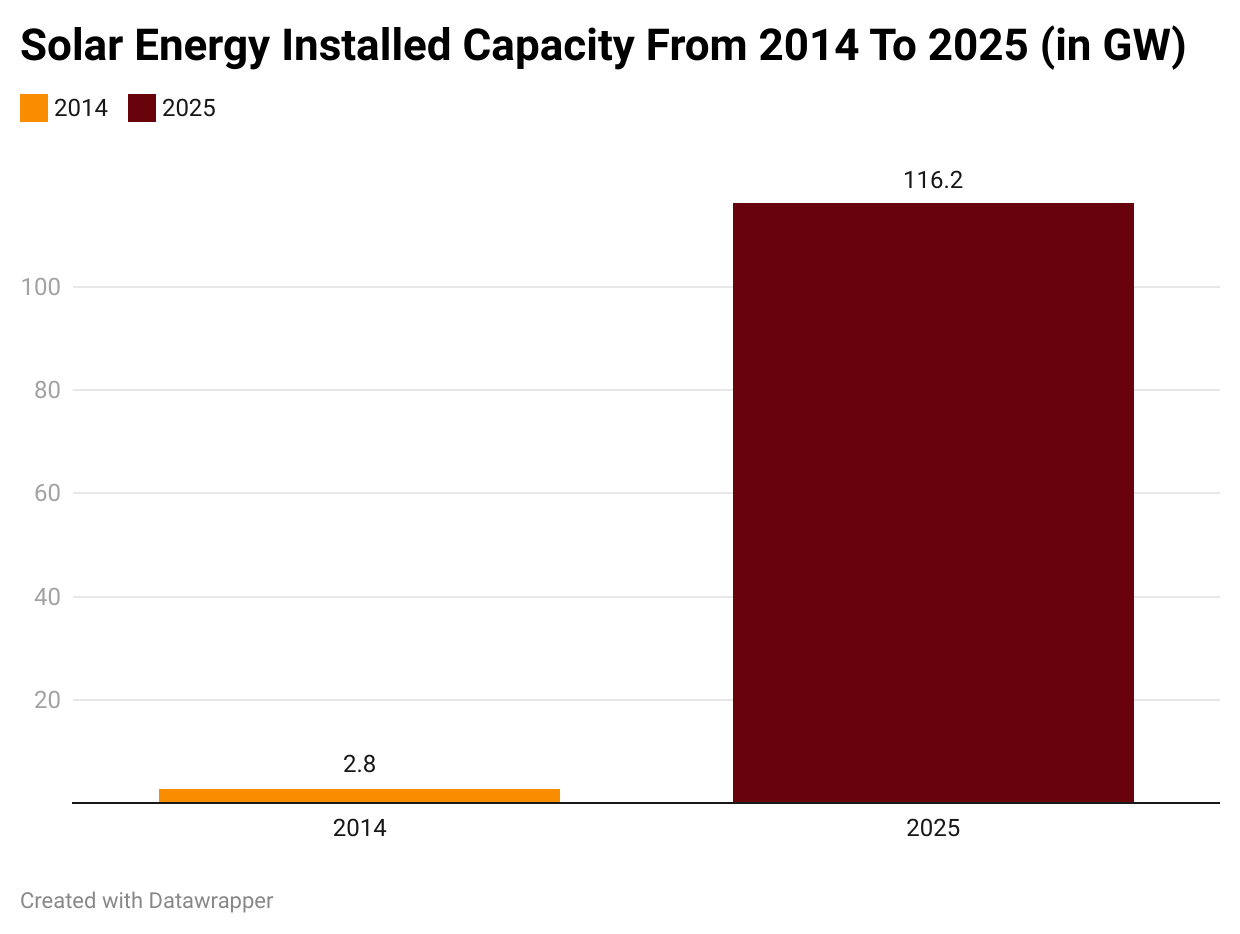
Solar Energy Alone Accounts For 48% Of India’s Total RE Capacity.
E. Steel :
Steel Trade Deficit Narrows To ₹ 1,195 Crore In July; Exports Edge Past Imports After 14 Months
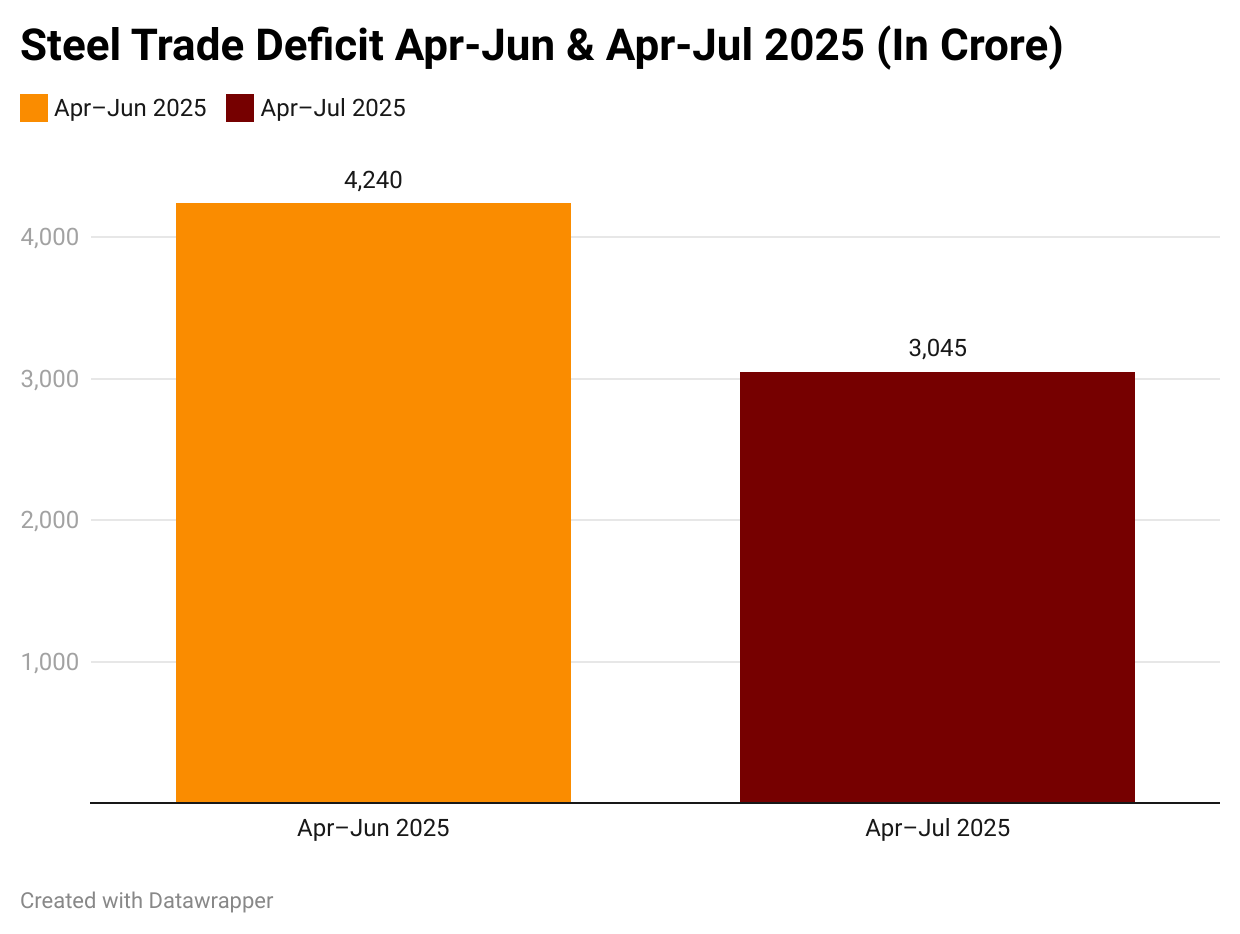
India’s steel trade gap narrowed sharply, witnessing a 28% contraction in just one month. The deficit came down from ₹ 4,240 crore in April–June (Q1FY26) to ₹ 3,045 crore for April–July 2025, implying a ₹ 1,195 crore turnaround in July alone.
Annexure I - Economic Updates in Detail :
A. Growth and Output :
Key Highlights -
Higher GDP Growth Rate: At 7.8%, India remains the fastest growing major economy in the world. This is higher than the 6.5% growth rate during the 2024-25 Q1. The growth is majorly driven by the service sector’s 9.3% growth. The agriculture sector also bounced back robustly with a 3.7% growth over last year’s 1.5%.
PMI: India’s manufacturing sector grew sharply in July, with the HSBC India Manufacturing Purchasing Managers’ Index (PMI) climbing to a 16-month high of 59.1, up from 58.4 in June, according to data released by S&P Global on Friday. The improvement was driven by strong gains in new orders and output, though business sentiment and hiring momentum showed signs of weakness. Similarly, the services PMI increased marginally to 60.5 in July from 60.4 in June to an 11 month high.
Rise In IIP: The Index of Industrial Production (IIP) grew by 3.5% in July 2025, up from 1.5% in June 2025. The overall index rose to 155.0 from 149.8 a year ago. While mining contracted by 7.2%, manufacturing and electricity registered growth of 5.4% and 0.6% respectively. Within manufacturing, strong contributions came from basic metals (12.7%), electrical equipment (15.9%), and non-metallic mineral products (9.5%).
B. Inflation And Price :
Key Highlights -
Lowest YOY CPI Inflation in Eight Years: Consumer Price Index (CPI) inflation cooled sharply to 1.55% in July 2025, the lowest since June 2017. This compares with 2.10% in June 2025 and 3.60% in July 2024, marking a consistent decline in retail inflation and showcasing effective price management in the economy.
Food Prices Enter Deflation: Food inflation slipped to –1.76% in July 2025, down from 1.01% in June 2025 and significantly lower than 5.42% in July 2024. The sharp fall was largely driven by the decline in prices of cereals, vegetables, and pulses, aided by a favorable base effect from last year’s high food inflation.
Wholesale Price Deflation: The Wholesale Price Index (WPI) recorded a contraction of –0.58% in July 2025, compared to 0.84% in June 2025 and 2.10% in July 2024. The fall was led by easing food articles and fuel prices, highlighting cost relief at the wholesale level. The sequential (month-on-month) WPI also reflected a moderation, consistent with the broader disinflationary trend.
Sticky Core Inflation: Core inflation (excluding food and fuel) remained elevated at 4.1% in July 2025, though slightly lower than 4.4% in June 2025. This was still higher than the 3.36% recorded in July 2024, pointing to persistent underlying price pressures in services and non-food categories. While manageable, it suggests that price rigidity outside food and fuel continues to weigh on inflation dynamics.
C. Trade and External Sector :
Key Highlights -
Steady Growth in Overall Exports: India’s total exports (merchandise and services combined) rose to $ 68.27 billion in July 2025, marking a growth of 4.52% compared with $ 65.30 billion in July 2024. Cumulatively, exports during April–July 2025 stood at $ 277.63 billion, reflecting a 5.23% year-on-year increase, underlining resilience in India’s external sector performance.
Moderate Expansion in Merchandise Exports: Cumulative merchandise exports amounted to $ 149.20 billion during April–July 2025, up from $ 144.76 billion in the same period of 2024, registering a growth of 3.07%. Non-petroleum exports provided additional strength, increasing by 7.70% to $ 127.46 billion.
Rising Imports Lead to Wider Deficit: Total imports (merchandise and services combined) increased to $ 79.99 billion in July 2025, a rise of 6.07% from $ 75.42 billion in July 2024. Consequently, the overall trade deficit widened to $ 11.72 billion in July 2025 compared with $ 10.12 billion a year earlier, reflecting higher import demand.
Strong Performance in Key Sectors: Major drivers of merchandise export growth in July 2025 included Engineering Goods, Electronic Goods, Gems and Jewellery, Drugs and Pharmaceuticals, and Organic and Inorganic Chemicals. Notably, Electronic Goods exports surged by 33.89% year-on-year, while Engineering Goods and Gems and Jewellery recorded growth of 13.75% and 28.95%, respectively, signalling robust demand in high-value segments.
D. Financial Health :
Key Highlights -
Rise in Foreign Exchange Reserves: India’s foreign exchange reserves climbed to $ 698.19 billion as of 25 July 2025, up by $ 2.7 billion from the previous level of $ 695.49 billion. The steady accumulation of reserves provides a strong buffer against external shocks and enhances macroeconomic stability.
Stable Monetary Policy: The Reserve Bank of India (RBI) maintained the repo rate at 5.50% in its latest policy review. The stance remains unchanged, reflecting a cautious balance between supporting growth and managing inflation expectations. The policy of the RBI has also remained unchanged signalling consistency in monetary policy amidst global uncertainties, including US tariff actions and trade deal volatility.
E. Fiscal Health :
Key Highlights -
Strong Growth in GST Collections: Gross Goods and Services Tax (GST) revenue rose to ₹ 1.96 lakh crore in July 2025, representing a 7.5% increase over ₹ 1.82 lakh crore in July 2024. The robust growth reflects healthy domestic consumption and improved compliance, reinforcing fiscal strength.
Direct Tax Collections Maintain Double-Digit Pace: Net direct tax collections reached ₹ 22.26 lakh crore in FY 2024-25, up 13.6% from ₹ 19.60 lakh crore in FY 2023-24. This strong growth underscores rising corporate profits and expanding personal incomes, supporting India’s fiscal consolidation efforts.
Continued Focus on Capital Expenditure: The Government has budgeted ₹ 11.2 lakh crore for capital expenditure in FY 2025-26, a 10% increase from ₹ 10.52 lakh crore in FY 2024-25. Sustained capex prioritises infrastructure and sustained economic growth, signaling a multiplier effect on development and job creation.
F. Labour And Employment :
Key Highlights -
Labour Participation Improved: The Labour Force Participation Rate (LFPR) increased to 54.9% in July 2025, up from 54.2% in June 2025. This rise suggests that more individuals, particularly in rural regions, are entering the labour market, either by seeking new jobs or re-joining the workforce.
Employment Absorption Increased: The Worker Population Ratio (WPR), which captures the proportion of working-age people actually employed, rose from 53.3% in June to 54.4% in July 2025. This improvement reflects stronger job absorption, especially in services and non-farm sectors, where employment opportunities have been expanding.
Unemployment Declined: The Unemployment Rate (UR) declined from 5.6% in June 2025 to 5.2% in July 2025, marking a significant month-on-month improvement. A reduction in unemployment alongside rising participation and higher worker absorption indicates that the labour market dynamics are moving in a favourable direction.
Annexure II - Sectoral Updates in Detail :
A. Agriculture and Allied :
Key Highlights -
Expansion in Major Crops: There has been a significant rise in rice cultivation, with area sown reaching 398.6 lakh hectares in 2025-26, up by 35.7 lakh hectares over last year. Coarse cereals also saw a jump of 9.1 lakh hectares, reflecting strong sowing trends and favourable seasonal conditions.
Steady Growth in Pulses and Sugarcane: Pulses area increased by 1.1 lakh hectares compared to 2024-25, driven by increased Government focus on pulse self-sufficiency and better market prices. Sugarcane area has also gone up by 1.6 lakh hectares, supported by continued high demand from the sugar and ethanol industries.
Decrease in Oilseeds, Cotton, and Jute and Mesta: Oilseed cultivation has decreased by 6.7 lakh hectares compared to the previous year, primarily due to shifts in cropping patterns. Cotton and jute and mesta areas declined by 3.2 lakh hectares and 0.2 lakh hectares, respectively, reflecting changing farmer preferences and local agro-climatic factors.
Overall Area Growth: The total area sown under all major Kharif crops for 2025-26 stands at 1039.8 lakh hectares, an increase of 37.4 lakh hectares compared to 2024-25. This expansion signals robust farm recovery and positive momentum in current kharif sowing across India.
B. Animal Husbandry :
Key Highlights -
India’s Position As Milk Producer: India continues to hold the position as the world’s largest milk producer, with a production of 239.3 million metric tonnes in 2023-24. It accounts for more than 25% of global milk production. Over the past decade, milk production in India has grown by 63.56%, at an annual growth rate of 5.7%.
More Than Global Average: This significantly outpaces the global average of 2%. The per capita availability of milk has also increased to over 471 grams per person per day. It is higher than the global average of 322 grams, indicating an ample supply to meet domestic demand.
C. Energy and Power :
Electricity Generation and Power Supply -
Key Highlights -
Major Capacity Jump: India’s total installed electricity capacity climbed to 4,90,050 MW by July 2025, up 3% from June 2025. This reflects sustained investment and expanded infrastructure for power generation.
Strong Generation Growth: Electricity generation reached 44,549 crore units in Q1 FY 2025-26, a sharp rise of 42.3% compared to the previous quarter, driven by robust demand and improved supply conditions.
Peak Demand Moderates: Peak power demand in July 2025 stood at 220.59 GW, slightly lower by 2.7% compared to July 2024, indicating some relief in load during the monsoon.
Coal :
Key Highlights -
Drop In Production: Coal production in India dropped by approximately 13.5% in July 2025 compared to June, falling to 68.16 million tonnes. This decline is mainly attributed to typical monsoon-related disruptions that affect mining operations and dispatch schedules. All major coal-producing subsidiaries reported decreases in output during this month, reflecting the seasonal slow-down in coal mining activity.
Overall Decline In Monsoon: Coal offtake also declined by about 8.7% in July, reaching 76.8 million tonnes, indicating reduced coal dispatches to power plants and industries. Despite this, pithead stock increased slightly to 120.2 million tonnes, providing a cushion to ensure supply reliability amid lower offtake. The stock build-up helps maintain coal availability for critical sectors during periods of fluctuating demand and constrained mining.
New and Renewable Energy :
Key Highlights -
Strong Capacity Growth: India’s renewable sector continues to expand. Solar capacity has risen sharply, reaching 116.24 GW in August 2025, almost half of the country’s total renewable capacity. States such as Rajasthan, Maharashtra, and Andhra Pradesh drive this growth. Schemes like PM Surya Ghar and PM-KUSUM play a central role in scaling household and farm-level solar adoption.
Ahead of Global Targets: By August 2025, India’s non-fossil fuel capacity stood at 242.8 GW, including 233.99 GW of renewable energy and 8.8 GW of nuclear power. This represents 50.07% of the total 484.82 GW power capacity, meeting the COP26 target five years early. India is now firmly on track to achieve 500 GW of non-fossil capacity by 2030.
Rise in Wind Energy: Wind power has reached 51.6 GW, showing steady growth. India holds a leading position in onshore wind installations worldwide. Offshore wind is the next frontier, supported by favourable policies and large coastal potential.
D. Manufacturing :
Steel -
Key Highlights -
Strong Output Growth: Steel production continued its upward momentum in July 2025, with the index of steel rising to 231.3 (2011–12 base year), a 12.8% year-on-year increase compared to July 2024 (205.1). This also represented a 3.3% month-on-month increase from June 2025 (223.8).
Sustained Cumulative Performance: During April-July 2025-26, the steel sector recorded a cumulative growth of 8.5% compared to the same period in 2024–25, underscoring consistent expansion across the first four months of the fiscal year.
Domestic Demand Resilience: The robust performance highlights strong underlying domestic demand, driven by public infrastructure spending, construction activity, and pre-monsoon project execution.
Cement -
Key Highlights -
Robust Growth: Cement production registered a strong 11.7% year-on-year increase in July 2025, showing solid momentum in the sector. This growth reflects improved supply capabilities and increased construction activity across the country.
Month-on-Month Rise: Cement output increased by 3.0% in July 2025 over June 2025. This steady climb shows that producers quickly responded to higher demand in the infrastructure and housing sectors.
Sustained Expansion: During April-July 2025, cumulative cement production rose by 8.9% compared to the same period last year. This sustained growth highlights the sector’s ongoing positive trend and its significant contribution to the core industries index.
Demand Momentum: The strong cement output is driven by robust infrastructure projects and active real estate development. Demand from roads, housing, and public works continues to absorb increased production, keeping the sector’s growth resilient and steady.
Conclusion :
India’s Growth Pulse in August 2025 reflects an economy entering a new phase of resilience, adaptability, and balanced development. Amid global uncertainty and persistent geopolitical headwinds, India’s ability to deliver strong growth while maintaining record-low inflation is a testament to robust domestic fundamentals and targeted policy interventions. Key achievements during this period such as GDP growth outpacing global peers, healthy employment absorption, higher export competitiveness, and early achievement of ambitious clean energy targets underscore the nation’s readiness for the next stage of economic transformation.
Looking ahead, continued momentum will depend on sustaining and broadening reform efforts, further integrating rural and urban economies, and remaining agile against future international shocks. Maintaining fiscal discipline, investing in infrastructure, supporting manufacturing scale-up, and strengthening export competitiveness are essential priorities to keep India’s growth durable and inclusive. The convergence of positive indicators across sectors ranging from agriculture to industry and services demonstrates the effectiveness of India’s policy framework and its potential to emerge as a developed economy by 2047.
In summary, the simultaneous achievement of low inflation, rising investment, expanding employment, and accelerated sectoral growth affirms India’s position as a global growth leader and inspires confidence in its journey towards sustainable prosperity.