

The October 2025 edition of India’s Growth Pulse captures an economy navigating a phase of confident stability amid mixed global currents. September’s data reveal a nuanced balance of robust domestic momentum anchored by investment and policy reforms, countered by external headwinds and a moderating industrial cycle. A strong first-quarter GDP growth of 7.8% has set a firm foundation for the fiscal year, prompting the RBI to upgrade its FY26 growth forecast to 6.8% and sharply lower its inflation projection to 2.6%, reflecting deep confidence in macroeconomic fundamentals.
Inflation remained benign across both retail and wholesale segments, supported by sustained deflation in food prices and structural fiscal measures such as the GST 2.0 reforms. Fiscal resilience was equally evident, with gross GST collections rising 9.1% YoY to ₹1.89 lakh crore, even as higher refund clearances signaled improved administrative efficiency. The industrial landscape showed steady though moderating growth, led by infrastructure, construction goods, and basic metals, underscoring an investment-led expansion rather than pure consumption recovery.
In parallel, labour market participation reached new highs, with the female LFPR climbing to 34.1%, marking a notable structural shift in employment patterns. On the policy front, initiatives such as the National Pulses Mission and India’s Blue Economy strategy highlighted the government’s focus on self-reliance, sustainability, and long-term resource optimization. Meanwhile, the power sector’s green transition accelerated, with renewables and hydro accounting for nearly all generation growth and a record 27.2 GW of renewable capacity added in just six months.
Together, these developments portray a confident economy consolidating its recovery through steady macro stewardship, reform-driven productivity, and a broad-based shift toward sustainable growth engines.
I. Key Highlights:
September 2025 presented a picture of confident stability for the Indian economy. Despite a moderation in core industrial output and emerging headwinds in the external sector, the macroeconomic narrative was positive. A surprisingly strong Q1 GDP performance led the RBI to upgrade its annual growth forecast. More significantly, a sharp and sustained fall in inflation, aided by structural policy reforms, provided the central bank with ample policy space. This allowed the Monetary Policy Committee to pause its rate cycle, signaling a shift from active intervention to a period of watchful waiting as the benefits of recent reforms and past rate cuts take full effect.
Robust Macro Outlook & Policy Pause: The RBI’s Monetary Policy Committee unanimously kept the policy repo rate unchanged at 5.50% and maintained a “neutral” stance. Reflecting a brightening outlook, the RBI upgraded its FY26 GDP growth forecast to 6.8% and sharply cut its CPI inflation projection to just 2.6%.
Strong Q1 GDP Performance: Real GDP grew 7.8% in Q1 FY26, solidifying India’s global standing. The expansion was broad-based, led by Services (9.3%), Manufacturing (7.7%), and a strong 7.8% growth in Gross Fixed Capital Formation (Investment).
Benign Inflation Dynamics: Price pressures eased significantly. Retail (CPI) inflation moderated further to 1.85% in September, driven by a -1.04% deflation in the food price index (CFPI). Wholesale (WPI) inflation also fell to a mere 0.13%.
Fiscal Resilience: Gross GST collections remained strong at ₹1.89 lakh crore in September, a 9.1% YoY growth. Net GST revenue growth was a more moderate 5.0% , as total refunds surged by 40.1% YoY, indicating an administrative push to clear backlogs.
Industrial Output & Investment: Industrial output moderated, with the IIP growing 4.0% and the ICI growing 3.0%. Growth was anchored by investment, with Infrastructure/Construction Goods up 10.5%. This was reflected in strong output from Basic Metals (+12.3%) and Cement (+4.3%).
Divergent Consumer Demand: A “two-speed” consumer story emerged from the IIP data. Consumer Durables output grew a robust 10.2% , while Consumer Non-durables (a proxy for broader household demand) contracted by -2.9%.
Labour Market Strength: The labor market showed structural expansion. The overall LFPR hit a 5-month high of 55.3%. Critically, the Female LFPR continued its growth, reaching 34.1%, its highest level since May.
External Sector Headwaves: The trade balance faced pressure. The overall trade deficit widened sharply by 93.26% to $16.61 billion ,driven by an 11.36% surge in imports while exports remained flat. Notably, services exports also contracted by 5.46%.
Major Policy Initiatives: The Government approved the ‘National Pulses Mission’ to target self-sufficiency (35M tonnes by 2030) backed by 100% MSP procurement for key pulses. NITI Aayog also launched a new “Blue Economy” strategy to harness the 7.16 million tonnes of untapped potential in India’s EEZ.
The Green Energy Transition: The power sector’s 3.05% YoY generation growth was driven entirely by non-fossil fuels. Renewable Energy (RES) generation surged 16.05% and Hydro by 7.37%. A record 27.2 GW of new RE capacity was added in the first half of the fiscal year.
The data from September reinforces the narrative of an economy in transition. The RBI’s decision to pause, backed by an upgrade in growth and a sharp cut in the inflation forecast, signals deep confidence in India’s macroeconomic fundamentals. This optimism is fueled by strong Q1 GDP figures and the disinflationary impact of structural reforms. However, this must be balanced against emerging headwinds seen in real-time data: a moderating industrial pace, a two-speed consumer, and a widening trade deficit. For policymakers, the key challenge is to ensure the investment-led expansion and green energy transition, both clear bright spots, are robust enough to counteract global softness and ensure the positive outlook translates into broad-based prosperity.
I. The Economic Pulse:
This section is dedicated to an overview of macro-fiscal performance. Each major topic is covered as a chapter, allowing for a deep dive into specific economic indicators.
A. Chapter 1 - RBI Monetary Policy
Snapshot-
RBI Holds Rates: The Monetary Policy Committee (MPC) unanimously voted to keep the policy repo rate unchanged at 5.50% and maintain its “neutral” stance.
GDP Growth Upgraded: The RBI revised its real GDP growth forecast for the full fiscal year (FY 2025-26) upwards to 6.8% from 6.5%. This was driven by a surprisingly strong Q1 performance, which saw the economy grow at 7.8%, the fastest pace in seven quarters.
Inflation Forecast Slashed: In a significant revision, the CPI inflation forecast for FY 2025-26 was lowered to just 2.6% from the earlier estimate of 3.1%.
Benign Inflation Drivers: The low inflation outlook is attributed to a sharp, 9-month-long decline in food prices and the expected “sobering impact on inflation” from the new GST 2.0 rationalisation reforms.
Resilient External Sector: India’s external fundamentals remain robust. The Current Account Deficit (CAD) narrowed significantly to just 0.2% of GDP in Q1 FY 2025-26, down from 0.9% a year ago.
Strong Investment Inflows: Gross FDI inflows remained strong at $37.7 billion during April-July 2025. Net FDI reached a 38-month high in July 2025.
In Detail-
The Monetary Policy Committee (MPC), meeting from September 29th to October 1st, 2025, delivered a message of confident stability. After a detailed assessment of the evolving macroeconomic conditions, the MPC voted unanimously to keep the policy repo rate unchanged at 5.50%. Consequently, the standing deposit facility (SDF) rate remains at 5.25% and the marginal standing facility (MSF) rate at 5.75%. The committee also opted to continue with its “neutral” stance.
The MPC’s decision to pause was driven by a positive, yet complex, economic picture. The committee noted that the inflation outlook had become more benign than anticipated, a development which created valuable policy space. However, while domestic growth was considered resilient, it was facing trade-related headwinds and prevailing global uncertainties in the second half of the fiscal year.
The MPC concluded that it was prudent to wait and observe the unfolding impact of several key factors: the front-loaded monetary policy actions (rate cuts) from earlier in the year, the impact of the recent GST 2.0 fiscal reforms, and the evolving global trade uncertainties.
The RBI’s confidence in the domestic economy was evident in its significant upward revision of the growth forecast. Real GDP growth for the current fiscal year (2025-26) is now projected at 6.8%, a notable increase from the 6.5% estimated in August.
This optimism is anchored in the Strong performance of Q1 (April-June), where the economy expanded by 7.8%. This growth was broad-based and driven by strong domestic drivers, including a 7.0% rise in private consumption and a robust 7.8% increase in gross fixed capital formation (investment). This domestic strength is also recognised by global agencies like Fitch and S&P, who have reaffirmed India’s strong growth prospects.
The most significant development was the sharp downward revision of the inflation forecast. The RBI has lowered its CPI inflation projection for FY 2025-26 to 2.6%, a steep drop from the 3.1% projected in August.
This revision was prompted by actual inflation coming in significantly lower than expected. The decline has been driven by two main factors. First, a sharp fall in food inflation, which has been in a steep, 9-month decline, the longest in the current CPI series. Second, the salubrious impact of the recent GST 2.0 reforms, which simplified the tax structure and lowered prices on many consumer items, is expected to have a further “sobering impact” on inflation.
India’s external position remains a pillar of stability. The Current Account Deficit (CAD) moderated significantly to just 0.2% of GDP in Q1, supported by strong services exports and robust remittances.
Global confidence in the Indian economy is reflected in strong capital inflows. Gross Foreign Direct Investment (FDI) inflows were strong at $37.7 billion in April-July 2025, with net FDI hitting a 38-month high in July. As of September 26, 2025, India’s foreign exchange reserves stood at a healthy $700.2 billion. This stability is reflected in the Indian Rupee, which “remained one of the least volatile emerging market currencies”.
B. Chapter 2 - Macroeconomic Performance: The Underpinnings of Growth
Snapshot-
Growth Metrics: India’s Real GDP grew 7.8% in Q1 FY26, up from 6.5% last year, while GVA rose 7.6%, reaffirming India as the world’s fastest-growing major economy.
Sectoral Performance: Services grew 9.3%, manufacturing 7.7%, construction 7.6%, and agriculture 3.7%, reflecting balanced expansion across all major sectors.
Indicators of Stable Momentum: Strong growth in both services and secondary sectors (manufacturing, construction) indicates stable, durable, and less fragile economic momentum.
Demand Side Growth: On the demand side, private consumption grew 7.0% (slower than last year), but this was offset by higher investment (7.8%) and government spending (9.7%).
Shift In Growth Driver: The economy is shifting toward an investment-led expansion, as government capital expenditure boosts productive capacity and encourages private sector investment.
In Detail-
GDP and GVA: The Primary Growth Engines
The Indian economy’s performance in the first quarter of the fiscal year 2025-26 was a testament to its broad-based strength. According to the National Statistics Office (NSO) under MoSPI, Real GDP is estimated to have grown by 7.8%, a substantial acceleration from the 6.5% growth recorded in the same period of the previous fiscal year. The Gross Value Added (GVA) also registered a strong growth of 7.6% at constant prices. This upward trajectory solidifies India’s position as the world’s fastest-growing major economy.
The sectoral breakdown of GVA demonstrates a synchronised expansion across the board, which is a key indicator of economic health. The Tertiary Sector, which includes services, was the main driver, recording a robust growth of 9.3% at constant prices. This represents a significant improvement over the 6.8% growth in Q1 of the previous year. The Secondary Sectors also contributed meaningfully, with both the manufacturing and construction sectors posting impressive gains of 7.7% and 7.6%, respectively. Both figures surpassed the 7.5% growth mark, indicating renewed vigor in industrial and infrastructure-related activities. Even the Agriculture and Allied Sector, which includes livestock and fishing, recorded a notable acceleration to 3.7%, up from 1.5% in the prior corresponding period.
The confluence of strong performance across the services, manufacturing, and construction sectors is a crucial development. A recovery driven solely by services is often viewed as fragile, but when paired with robust growth in the secondary sector, it suggests that investment and production are translating into tangible economic output. This synergy creates a more stable and durable growth path, less vulnerable to external shocks. The acceleration in the agriculture sector also contributes to a comprehensive and inclusive growth narrative, supporting a wider demographic base.
Demand-Side Drivers: Consumption, Investment, and Government Spending
An in-depth analysis of the demand-side components of the economy reveals a strategic shift in the drivers of growth. While Real Private Final Consumption Expenditure (PFCE) grew by 7.0% in Q1 FY26, a moderation from the 8.3% growth in the corresponding period last year, this was more than compensated for by a significant uptick in investment and Government spending.
Gross Fixed Capital Formation (GFCF), a key proxy for investment, recorded a strong growth rate of 7.8% at constant prices, improving from 6.7% in Q1 FY24. Simultaneously, Government Final Consumption Expenditure (GFCE) rebounded sharply with a 9.7% growth rate in nominal terms, a substantial increase over the 4.0% in Q1 FY24.
The decline in the growth rate of private consumption, while not a cause for alarm given its robust level, is a nuanced development. However, the simultaneous acceleration in both private and public investment points to a desirable shift in the composition of demand. This indicates that government-led capital expenditure is effectively laying the groundwork for future productive capacity and is likely crowding in private sector investment. It suggests that the economy is transitioning from a consumption-led recovery to an investment-led expansion.
C. Chapter 3 - Tax Collections
Snapshot-
Gross GST Revenue: Gross GST collections remained robust at ₹1,89,017 crore in September 2025.
Gross Revenue Growth (YoY): This represents a strong 9.1% year-on-year growth over the ₹1,73,240 crore collected in September 2024.
Driver of Growth (Imports): The headline growth was driven by a 15.6% surge in GST from imports (₹52,492 crore), while domestic revenue grew at a steady 6.8% (₹1,36,525 crore).
Net Revenue Growth (YoY): Net GST revenue (post-refunds) showed a more moderate 5.0% year-on-year growth, standing at ₹1,60,360 crore.
The Refund Story: The divergence between strong gross growth (9.1%) and moderate net growth (5.0%) is explained by a massive 40.1% year-on-year increase in the value of refunds issued, which totalled ₹28,657 crore.
H1 FY26 Performance: For the first half of the fiscal year (April-Sept 2025), total Gross GST collections have grown 9.8% to ₹11.93 lakh crore, with cumulative Net collections growing 8.3% to ₹10.38 lakh crore.
In Detail-
Gross Goods and Services Tax (GST) collections remained robust in September 2025, reaching ₹1,89,017 crore. This represents a strong 9.1% year-on-year (YoY) growth over the ₹1,73,240 crore collected in the same month last year, indicating steady economic activity and consumption.
The headline growth was driven by a significant surge in revenues from imports. Gross revenue from domestic transactions grew at a healthy 6.8% (to ₹1,36,525 crore), while revenue from imports (IGST and CESS on imports) jumped by 15.6% (to ₹52,492 crore). This reflects the strong import activity also seen in the external sector data.
While gross revenues were strong, the Net GST Revenue for September 2025 stood at ₹1,60,360 crore, a more moderate 5.0% (YoY) growth over the net collections from September 2024.
This divergence between high gross growth and moderate net growth is explained by a significant increase in the value of refunds. Total refunds issued in September 2025 were ₹28,657 crore, a massive 40.1% increase compared to the ₹20,453 crore in refunds issued in September 2024. This continues the trend seen in August of an administrative push to clear refund backlogs.
For the first half of the fiscal year (April-September 2025), the total Gross GST collection stands at ₹11,93,431 crore, clocking a 9.8% (YoY) growth. The cumulative Net GST collection for this period is ₹10,38,476 crore, showing an 8.3% (YoY) growth.
State-wise domestic revenues showed varied performance. Overall domestic collections saw a 7% growth. Several states posted high double-digit growth, including Meghalaya (27%), Sikkim (22%), Andaman and Nicobar Islands (22%), Madhya Pradesh (21%), and Bihar (17%). In contrast, a few states, such as Telangana (-5%), Himachal Pradesh (-4%), Delhi (-1%), and Manipur (-1%), recorded a contraction in revenues for the month.
D. Chapter 4 - Growth and Output
Snapshot-
Industrial Output Moderates: India’s industrial output showed moderate growth, with the Index of Industrial Production (IIP) rising 4.0% (YoY) in September 2025. This was broadly in line with the Index of Eight Core Industries (ICI), which grew 3.0% (YoY).
Cumulative Growth Aligns: Cumulative growth for the first half of the fiscal year (April-September 2025) was aligned, with the IIP growing 3.0% and the ICI expanding by 2.9%.
Manufacturing and Infra Lead: The IIP’s growth was driven by a 4.8% rise in the Manufacturing sector and a robust 10.5% surge in Infrastructure/Construction Goods. This aligns with the ICI’s key drivers: Steel (+14.1%) and Cement (+5.3%).
Investment Goods Surge: The investment-led theme continued, with IIP data showing strong growth in Capital Goods (+4.7%) and Basic Metals (+12.3%).
Split Consumer Demand: The IIP data revealed a stark divergence in consumption. Consumer Durables output grew a strong 10.2% (YoY), while Consumer Non-durables (a proxy for broader household demand) contracted by -2.9% (YoY).
PMI Signals Caution: The forward-looking Manufacturing PMI, while expansionary at 57.7, eased from its 17-year high of 59.8 in August, reflecting a noticeable slowdown in new orders and a marginal pace of job creation.
In Detail-
India’s industrial output showed moderate growth in September 2025, cooling from the robust pace seen in August. The broad-based Index of Industrial Production (IIP) registered a 4.0% year-on-year (YoY) increase. This figure was consistent with the 3.0% (YoY) growth recorded by the Index of Eight Core Industries (ICI).
This represents a significant moderation from the finalised 6.5% core sector growth seen in August, suggesting a return to a more tempered growth trajectory.
The cumulative picture for the first half of the fiscal year (April-September 2025-26) shows this alignment. The IIP grew by 3.0% over this period, while the ICI expanded by 2.9%.
A sectoral breakdown of the IIP reveals that the Manufacturing sector was the primary engine, growing by 4.8% (YoY). The Electricity sector also contributed with 3.1% growth. However, the Mining sector acted as a drag, contracting by -0.4% (YoY).
The core weakness in the primary sector was more pronounced in the ICI data, which is heavily weighted towards energy. There were broad-based (YoY) contractions in Coal (-1.2%), Crude Oil (-1.3%), Natural Gas (-3.8%), and Petroleum Refinery Products (-3.7%). This weakness in the energy basket explains why the ICI’s headline growth (3.0%) was lower than the broader IIP’s (4.0%).
Within the strong manufacturing sector, growth was concentrated in high-value, investment-driven industries. The top three positive contributors were “Manufacture of electrical equipment” (surging 28.7%), “Manufacture of motor vehicles” (+14.6%), and “Manufacture of basic metals” (+12.3%).
The IIP’s use-based classification confirms that the economy’s growth remains investment-led, a key theme from the August report. Infrastructure/Construction Goods posted a robust 10.5% (YoY) growth.
This was strongly supported by the growth in Capital Goods, a direct proxy for investment, which grew by 4.7% (YoY). The ICI’s strong performance in Steel (+14.1%) and Cement (+5.3%) is a direct reflection of this sustained demand from infrastructure and construction.
Conversely, the IIP data highlighted a starkly “two-speed” consumer story. Consumer Durables output, reflecting strong urban and festive demand, grew by an impressive 10.2% (YoY). However, Consumer Non-durables, a key indicator of broader rural and household demand, contracted by -2.9% (YoY), signalling persistent weakness in that segment.
The forward-looking HSBC India Manufacturing Purchasing Managers’ Index (PMI) also signalled a note of caution. The index fell from a 17-year high of 59.8 in August to a four-month low of 57.7 in September. While any reading above 50 signifies expansion, the sharp drop indicates a palpable loss of momentum.
This PMI slowdown was attributed to a “noticeable slowdown in new orders,” which rose at the weakest pace in four months. This softening demand had a direct impact on the labour market, as firms reported that “job creation slowed to a marginal pace.”
E. Chapter 5 - Price Dynamics And Inflationary Environment
Snapshot-
Retail Inflation: Retail inflation (CPI) moderated further to 1.85% in September 2025, down from 2.07% in August, remaining comfortably within the central bank’s target.
Wholesale Inflation: Wholesale inflation (WPI) also eased, falling to 0.13% in September from 0.52% in August, though manufactured product inflation remained firm at 2.33%.
Food Price Index: The low CPI was driven by continued deflation in the Consumer Food Price Index (CFPI), which registered at -1.04%.
Inflation for rural India diverged: the CPI for Agricultural Labourers (AL) showed deflation at -0.07%, while Rural Labourers (RL) saw a slight increase of 0.31%.
Kerala Inflation: Despite low national inflation, significant price pressures were seen in several states, with Kerala reporting the highest inflation at 9.05%.
WPI Structural Shift: A divergence in WPI, with deflation in raw materials but inflation in manufactured goods, suggests firms are managing costs or rebuilding margins
In Detail-
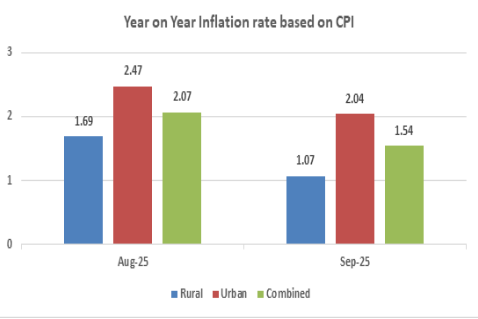
India’s price environment was characterised by remarkable stability in September 2025. Retail inflation, as measured by the Consumer Price Index (CPI), eased further to 1.85% (YoY), down from 2.07% in August. This marks the third straight month that CPI has remained comfortably below the 3 per cent mark, consolidating the trend of benign consumer prices.
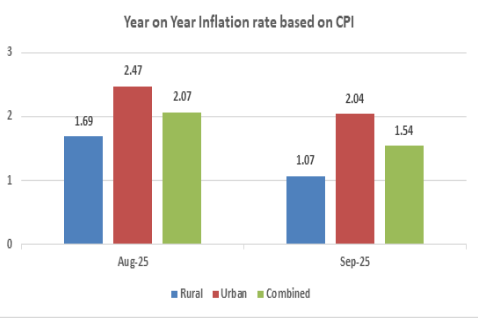
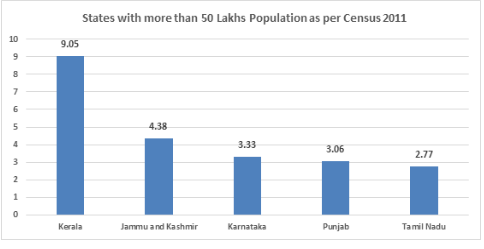
Image1: YOY Inflation Rate Based On CPI The main driver of this moderation was the continued deflation in food prices. The Consumer Food Price Index (CFPI) registered a -1.04% (YoY) decline. However, this stable national average conceals significant regional disparities. A few states experienced sharp price rises, with Kerala (9.05%), Jammu and Kashmir (4.38%), and Karnataka (3.33%) recording the highest inflation.
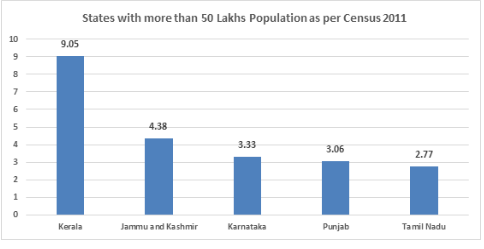
Image 2: Top five major states with high Year on Year inflation for the month of September, 2025 are shown in the graph below. At the producer level, the Wholesale Price Index (WPI) also cooled, with annual inflation at 0.13% (Provisional) in September, compared to 0.52% in August. The WPI’s stability was aided by deflation in ‘Primary Articles’ (-3.32%) and ‘Fuel & Power’ (-2.58%). In contrast, the ‘Manufactured Products’ component recorded a firm inflation rate of 2.33%, suggesting persistent price pressures in finished goods.
A deeper look into the rural economy revealed a split in price trends. The year-on-year inflation for Agricultural Labourers (CPI-AL) entered deflationary territory, falling to -0.07%. In contrast, inflation for Rural Labourers (CPI-RL) remained positive at 0.31%. This was largely due to sharp deflation in food prices for both groups, with the food index for AL at -2.35% and for RL at -1.81%.
The data presents a complex picture. While headline CPI and WPI are exceptionally low, the divergence between falling raw material costs and firm manufactured goods inflation is notable. It suggests that while input costs are falling, firms may be rebuilding profit margins rather than passing on the full benefit of lower costs to consumers, a trend that was also highlighted in the August analysis.
F. Chapter 6 - Labor and Employment: Rising Female Workforce Participation
Snapshot-
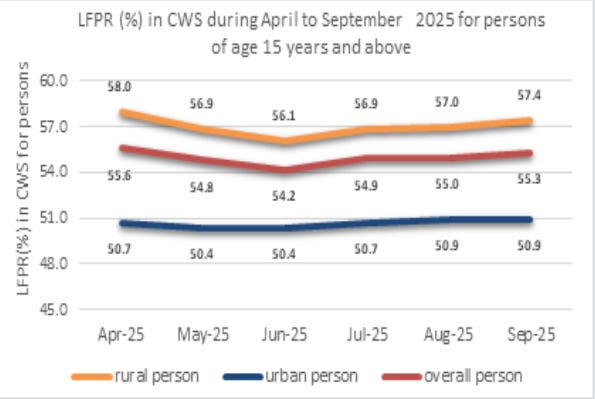
Labour Force Participation Rate: The increasing trend in the Labour Force Participation Rate (LFPR) continues, with the overall LFPR reaching a five-month high of 55.3% in September 2025.
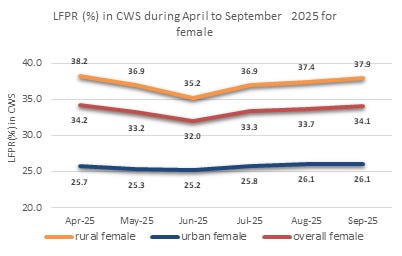
Female Participation: Participation of females in the labour force continues to grow. The LFPR among females (aged 15+) reached 34.1%, the highest level observed since May 2025.
Worker Population Ratio : The overall WPR (aged 15+) was reported at 52.4%, its highest level since May 2025.
Female Worker Population Ratio: The WPR among females (aged 15+) has steadily increased for the third month in a row, reinforcing the positive structural trend seen in August .
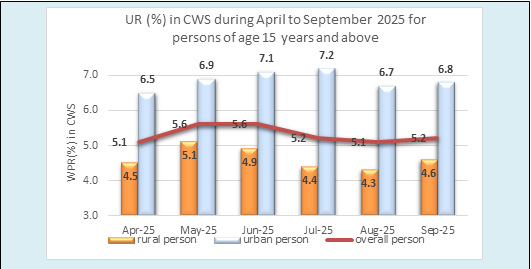
Unemployment Rate: The overall UR (aged 15+) increased marginally to 5.2% in September 2025 from 5.1% recorded in August, after declining for the two previous months.
In Detail-
The labour market showed encouraging signs of a structural expansion in September 2025, even as the headline unemployment rate saw a minor increase. The overall Labour Force Participation Rate (LFPR) continued its upward trend, reaching a five-month high of 55.3%. This was mirrored by the Worker Population Ratio (WPR), which also rose to 52.4%, its highest since May 2025.
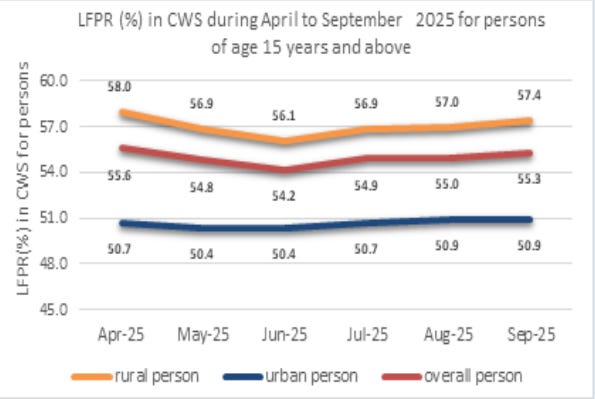
Image3: LFPR(%) in CWS during April to September 2025 for persons of age 15 years and above The most significant and positive development is the continued, sustained rise in female workforce engagement. The female LFPR (aged 15+) climbed to 34.1%, its highest level in five months. Furthermore, the female WPR increased for the third consecutive month, confirming the “potential structural shift” noted in the August report. This expansion of the labour pool is a crucial development for long-term economic growth.
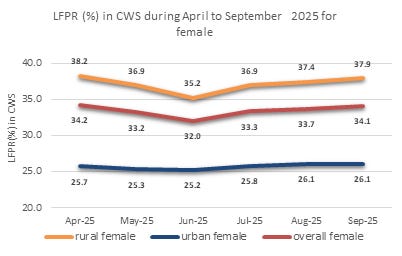
Image4:LFPR(%) in CWS during April to September 2025 for female This positive narrative of an expanding labour force provides important context for the month’s unemployment figures. The overall Unemployment Rate (UR) increased marginally to 5.2% from 5.1% in August.
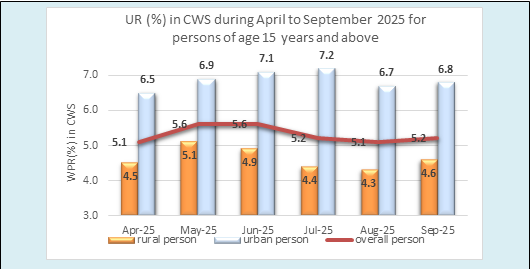
Image5: UR(%) in CWS during April to September 2025 for persons of age 15 years and above This slight uptick in the UR, when viewed alongside a strong rise in the LFPR, is not necessarily a negative signal. It indicates that more people, particularly women are confidently entering or re-entering the labour force to actively seek employment, rather than staying on the sidelines. This suggests a growing optimism in the economy, even if it temporarily increases the number of people counted as “unemployed”.
G. Chapter 7 - Trade and External Sector
Snapshot-
Trade Deficit: India’s overall trade deficit widened sharply by 93.26% in September 2025, increasing to $16.61 billion from $8.60 billion in September 2024.
Imports $ Exports: This was driven by a significant 11.36% year-on-year (YoY) rise in total imports, whilst total exports saw near flat growth of just 0.78%.
Merchandise Import Growth: Merchandise imports surged by 16.67% to $68.53 billion, far outpacing the 6.75% growth in merchandise exports.
Services Sector Export: The services sector faced headwinds, with exports contracting by 5.46% (YoY) to $30.82 billion, a sharp reversal from the strong growth seen in previous months.
Services Surplus Maintained: Despite the export contraction, the services sector still recorded a robust trade surplus of $15.29 billion, as services imports also fell by 7.56%.
In Detail-
India’s external sector faced significant pressure in September 2025. The overall trade deficit widened sharply to $16.61 billion, a 93.26% increase over the $8.60 billion deficit recorded in September 2024. The deficit expansion was driven by a pronounced surge in total imports, which grew 11.36% (YoY) to $83.82 billion. In contrast, total exports (merchandise + services) remained nearly flat, registering a marginal growth of just 0.78%.
The merchandise trade deficit was the main contributor to the overall imbalance, with merchandise exports rising modestly by 6.75% (YoY) to $36.38 billion, while imports surged by 16.67% to $68.53 billion. A more concerning trend emerged in the services sector, where exports contracted by 5.46% (YoY) to $30.82 billion.
However, a deeper look at the trade composition, excluding volatile petroleum and gems & jewellery, reveals a more resilient underlying trend. ‘Core’ exports (Non-petroleum & Non-Gems & Jewellery) grew to $28.59 billion in September 2025, up from $26.95 billion in September 2024. For the first half of the fiscal year (April - September 2025), these core exports stand at $175.29 billion, a healthy increase from $163.09 billion last year.
The growth in merchandise exports was supported by a diverse range of commodities. Key sectors showing strong positive (YoY) growth in September were Cashew (+106.41%), Electronic Goods (+50.54%), Iron Ore (+52.25%), Rice (+33.18%), and Marine Products (+23.44%). This indicates broad based strength beyond the traditional petroleum and gems sectors.
On the import side, despite the headline surge, there was notable moderation in key commodity groups. Imports of Coal, Coke & Briquettes fell by -16.4% (YoY), and the largest import item, Petroleum, Crude & Products, also saw a decline of -5.85%. This moderation in energy related imports helped prevent a further widening of the deficit.
Finally, putting India’s performance in a global context, the Department of Commerce acknowledged the IMF’s October World Economic Outlook. The IMF has revised India’s 2025 GDP growth projection upward to 6.6% (from 6.2% in 2026), citing strong performance in the first quarter of the fiscal year, which offset the impact of US tariff increases. India continues to be a “bright spot in the global economy”.
II. Sectoral Performance:
This second part would analyse the performance of key sectors within the economy. Each sector would be a dedicated chapter, providing a focused view of its health and trends.
A. Chapter 8 - Agriculture & Allied Sector
Snapshot-
Overall Sowing Rise: Total Kharif crop sowing exceeded 1121.46 lakh hectares as of 3rd October, 2025, marginally higher than the 1114.95 lakh hectares sown by the same time last year.
Strong Coarse Cereals: Sowing of Coarse Cereals (Shri Anna) showed robust growth, increasing by over 6% (11.13 lakh ha) to 194.67 lakh hectares.
Maize Leads Growth: This boost was led by Maize, which saw its sowing area increase by over 12% (10.65 lakh ha) to 94.95 lakh hectares.
Urad Area Up: Pulses also showed positive growth, led by Urad, which registered a 6.5% increase (1.50 lakh ha) in its sowing area.
Oilseeds Decline: In contrast, Oilseeds sowing recorded a significant decline of over 5% (10.62 lakh ha), falling to 190.13 lakh hectares, driven by a large drop in Soybean acreage.
Mixed Cash Crops: Rice sowing saw a healthy increase of 5.90 lakh hectares, while key cash crops like Cotton (-2.94 lakh ha) and Jute & Mesta (-0.18 lakh ha) saw a decline in acreage.
In Detail-
Overall Sowing Trends: The final Kharif sowing data as of early October 2025 confirms a total area coverage of 1121.46 lakh hectares. This is a marginal increase of 6.51 lakh hectares over the 1114.95 lakh hectares covered by the same time last year. However, this stable headline figure masks a significant divergence in sowing trends across major crop categories.
Coarse Cereals Surge: The strongest growth was seen in Coarse Cereals (Shri Anna), which, as the government highlighted, “zoomed ahead”. The total area under coarse cereals increased to 194.67 lakh hectares, a substantial 11.13 lakh hectare jump from the 183.54 lakh hectares sown last year. The primary driver of this boost was Maize, which saw its acreage expand by over 12% to 94.95 lakh hectares.
Pulses Growth: Pulses also registered positive growth, reaching 120.41 lakh hectares. This was led by Urad, which saw a 6.5% increase in its sowing area. Rice, the largest Kharif crop, also posted a healthy 5.90 lakh hectare increase, reaching 441.58 lakh hectares.
Oilseeds Decline: This positive performance in cereals and pulses was largely offset by a significant contraction in major cash crops. Oilseeds sowing saw a major decline, falling by 10.62 lakh hectares to 190.13 lakh hectares. This was almost entirely due to a 9.10 lakh hectare drop in Soybean acreage. Similarly, Cotton acreage fell by 2.94 lakh hectares, and Jute & Mesta also saw a decline of 0.18 lakh hectares compared to the previous year. This sectoral shift in acreage away from cash crops and oilseeds towards cereals could have implications for domestic edible oil and fibre production.
B. Chapter 9 - NATIONAL PULSES MISSION
Snapshot-
New Mission Launched: The Union Cabinet has approved the ‘National Pulses Mission’ (Mission for Aatmanirbharta in Pulses) for a six-year period from 2025-26 to 2030-31
Clear Production Targets: The mission’s primary target is to achieve self-sufficiency (Aatmanirbharta) by increasing domestic pulses production from 24.2 million tonnes (2024-25 est.) to 35 million tonnes by 2030-31
Significant Budget Outlay: A financial outlay of ₹11,440 crore has been allocated for the mission, which will be implemented across 416 districts
Guaranteed Procurement: A key feature is the guarantee of 100% procurement of Tur, Urad, and Lentils at the Minimum Support Price (MSP) from registered farmers for the next four years.
MSP Hikes to Incentivise Sowing: The new policy was launched alongside significant MSP hikes for Rabi crops (2026-27 marketing season), with the highest absolute increase for Lentils (Masur) (up ₹300) and Gram (Chana) (up ₹225) among key pulses
In Detail -
National Pulses Mission: In a major policy move this month, the Union Cabinet approved this Mission for Aatmanirbharta in Pulses. This six-year, ₹11,440 crore scheme aims to make India self-sufficient in pulses, enhance nutritional security, and boost farmer incomes.
Ambitious Production Target: The mission sets a clear and ambitious target: to increase domestic production from an estimated 24.2 million tonnes in 2024-25 to 35 million tonnes by 2030-31. This will be achieved by expanding the cultivation area (by 3.5 million hectares, often in rice fallow areas) and, more importantly, increasing the average yield from 881 kg to 1,130 kg per hectare.
Farmer Incentive Framework: The core of the new policy is a powerful incentive structure for farmers. The government has guaranteed 100% procurement of Tur, Urad, and Lentils at the MSP for the next four years from all registered farmers. This provides a crucial safety net and removes price risk, which has historically deterred farmers from planting pulses.
MSP Hike Announced: To further incentivise this shift, the mission was announced concurrently with a significant hike in the MSP for Rabi crops. Among pulses, Lentils (Masur) received a ₹300/quintal increase to ₹7,000, and Gram (Chana) was hiked by ₹225/quintal to ₹5,875 . These new prices ensure a high margin over the cost of production (89% for Lentils, 59% for Gram), making them highly remunerative.
Trade Balance Impact: This mission directly supports the positive macroeconomic trends seen in this report. The push for domestic production is aimed squarely at reducing import dependency which will help stabilise the trade balance.
Inflation Stabilisation Measure: Furthermore, this policy is a key structural measure to ensure long-term food price stability. The success in pulses production is a primary reason for the deflation seen in the CPI’s pulses component and will be crucial for maintaining benign inflation, as noted in the RBI’s recent monetary policy statement.
Comprehensive Support Strategy: The mission is not just about price incentives. It includes a comprehensive strategy to distribute 126 lakh quintals of certified high-yield seeds, provide 88 lakh free seed kits, and establish 1,000 post-harvest processing and packaging units to reduce losses and improve value addition for farmers.
C. Chapter 10 - HARNESSING THE BLUE ECONOMY
Snapshot -
New National Strategy: NITI Aayog released a comprehensive report, “India’s Blue Economy: Strategy for Harnessing Deep-Sea and Offshore Fisheries,” this month.
A ‘Sunrise Sector’: India is the world’s second-largest fish producer, with the sector supporting 30 million livelihoods and earning ₹60,523 crore in exports in FY 2023-24.
Vast Untapped Potential: The nation’s deep-sea resources, particularly in the 2 million sq. km Exclusive Economic Zone (EEZ), remain “largely unexploited”.
Quantified Opportunity: The estimated potential yield from India’s EEZ is 7.16 million tonnes, including high-value species like tuna, billfish, and deep-sea shrimp.
Six-Point Intervention: The report identifies six key policy interventions: (1) overhauling policies and regulations, (2) institutional strengthening, (3) fleet modernisation, (4) sustainable management, (5) resource mobilisation, and (6) stakeholder inclusion.
Phased Roadmap: The strategy proposes a three-phase implementation: Phase 1 (2025-28) for laying the foundation, Phase 2 (2029-32) for scaling up, and Phase 3 (2033+) to establish global leadership.
In Detail-
Focus on Blue Economy: Following major structural reforms in taxation (GST 2.0) and agriculture (National Pulses Mission), the government’s focus has expanded to the ‘Blue Economy’. This month, NITI Aayog released a strategic report outlining a roadmap to develop India’s vast, yet underexploited, deep-sea and offshore fisheries.
Sectoral Significance: The fisheries sector has been identified as a ‘sunrise sector’, and for good reason. India is already the world’s second-largest fish producer, accounting for 8% of global production. The sector provides a livelihood for nearly 30 million people and is a significant source of foreign exchange, earning ₹60,523 crore in exports in FY 2023-24.
Coastal Resource Strain: The report’s central finding is that India’s current success is almost entirely based on coastal and inshore resources, which are now facing stress from overfishing and habitat degradation. The vast potential of the country’s 2.02 million sq. km Exclusive Economic Zone (EEZ) remains “largely unexploited”.
Untapped Deep-Sea Potential: This untapped potential is estimated at 7.16 million tonnes, including high-value species like tuna, billfish, and deep-sea shrimp. For instance, the potential for oceanic resources (tuna, sharks, etc.) alone is over 2,30,000 tonnes, yet India’s participation in high-seas fisheries is minimal, with only four Indian-flagged vessels available for high-seas fishing as of 2023.
Key Development Challenges: The strategy identifies several key challenges hindering this development. These include a “fragmented regulatory framework” (India currently has no specific laws for fisheries in the 12-200 nmi zone), critical gaps in infrastructure (lack of deep-sea harbours and cold chains), and a lack of access to financing for modern, capital-intensive vessels.
Three-Phase Roadmap: To address this, the report proposes a three-phased roadmap.
Phase 1 (2025-28): This will focus on “laying the foundation” by enacting comprehensive legislation, establishing a national digital platform (ReALCRaft) for vessel registration, and upgrading major fishing harbours.
Phase 2 (2029-32): This will focus on “scaling up” by supporting the large-scale induction of modern deep-sea vessels, strengthening shipbuilding capacity, and expanding the on-board observer program and 100% VMS coverage to ensure sustainability.
Phase 3 (2033 onwards): This aims for “global leadership” by focusing on high-value product development and enforcing ecosystem-based fisheries management.
Sustainability and Growth Vision: This strategy, supported by schemes like the Pradhan Mantri Matsya Sampada Yojana (PMMSY), is a critical component of India’s broader economic plan. It aims to create sustainable economic growth, ensure food and nutritional security (SDG 2), and generate new employment, all while reducing pressure on stressed coastal ecosystems.
D. Chapter 11 - Coal
Snapshot-
Slight Output Dip: Total coal production in September 2025 saw a minor year-on-year (YoY) decline of 1.05%, falling to 68.18 million tonnes (MT) from 68.90 MT last year.
Dispatches Marginally Lower: Total coal dispatch (offtake) also registered a slight dip of 0.18% to 73.97 MT , primarily driven by a 1.93% decline in dispatches to the power sector.
Private Mining Growth: The trend of strong growth in private and commercial mining continued. Production from Captive and Other mines was a key bright spot, growing 9.08% YoY to reach 15.50 MT.
Captive Demand Rise: Dispatches from Captive mines also grew by 6.24%, reflecting sustained demand from captive power plants (CPP), steel, and cement industries.
In Detail -
Coal Production: The coal sector experienced a slight moderation in September 2025. Overall national coal production registered a minor year-on-year contraction of 1.05%, with total output at 68.18 MT. This follows a period of strong growth seen in the preceding months.
Dispatches Edge Down: This moderation was mirrored in coal dispatches (offtake), which fell by 0.18% to 73.97 MT. A primary driver for this dip was the reduced offtake by the power sector, which saw its dispatches fall by 1.92% to 59.08 MT.
Private Output Surges: However, the headline figures, which are dominated by Coal India (CIL), mask a strong and divergent trend in the private sector. Production from Captive and Other mines continued its robust growth, surging by 9.13% year-on-year to reach 15.50 MT.
Industrial Demand Robust: This strong production translated directly into higher dispatches from private mines, with offtake from Captive mines rising by 6.24% to 15.78 MT. This indicates that demand from key end-use industries like captive power plants (which saw a 15.4% rise in offtake ), steel (+23.55% ), and other non-regulated sectors remains strong, supporting the ongoing shift in India’s coal production landscape.
E. Chapter 12 - Energy and Power
Snapshot-
Overall Generation Growth: All-India electricity generation increased by 3.05% year-on-year (YoY) in September 2025, reaching 156,518 GWh.
Renewable & Hydro Boost: Growth was driven by a 16.05% surge in generation from Renewable Energy Sources (RES) and a 7.37% rise from Hydro, which offset declines in Nuclear (-18.07%) and Lignite (-3.55%) generation.
Record Non-Fossil Capacity: Total non-fossil fuel installed capacity reached a new high of 256.09 GW as of 30 September 2025, comprising 247.31 GW of renewable energy (R E) and 8.78 GW of nuclear power.
Monthly RE Additions: The pace of transition accelerated, with 4,683.86 MW (4.68 GW) of new RE capacity added in September 2025 alone, dominated by 4,202.16 MW from Solar.
H1 Capacity Surge: In the first half of the fiscal year (Apr-Sept 2025), a record 27.2 GW of new RE capacity was added, underscoring the rapid expansion of the sector.
In Detail -
Power Growth: India’s power sector registered moderate generation growth in September 2025. Overall electricity generation increased by 3.05% (YoY) to 156,518 GWh. This growth was almost entirely driven by non-fossil fuel sources, highlighting the ongoing green transition.
Green Energy Drives: An analysis of the energy mix shows generation from Renewable Energy Sources (RES) surged by a robust 16.05% (YoY), while Hydro power generation also grew 7.37%. This green energy increase was crucial, as it compensated for flat coal-based generation (+0.75%) and sharp declines in nuclear (-18.07%) and lignite (-3.55%) generation.
Renewables Surge Ahead: The more significant story continues to be the rapid expansion of installed capacity. The first half of the fiscal year (April-September 2025) saw a record-breaking 27.2 GW of new renewable energy capacity added to the grid. The momentum continued in September, with 4.68 GW of new RE capacity added in the month alone.
Fossil Output Flattens: As of 30th September 2025, India’s total installed non-fossil fuel capacity has reached a new milestone of 256.09 GW. This includes over 127 GW from solar and 53 GW from wind. This rapid deployment demonstrates the success of policy measures, including the GST reductions on RE devices noted in the August report , in accelerating the nation’s energy transition.
F. Chapter 13 - Manufacturing and Industrial Output
Snapshot-
Steel Sector Leads Growth: The steel sector was a primary driver of industrial output in September 2025. The “Manufacture of basic metals” category surged by 12.3% year-on-year (YoY).
Broad-Based Steel Production: Growth in the sector was comprehensive, with the National Statistics Office noting significant contributions from “MS slabs,” “HR coils and sheets of mild steel,” and “Flat products of Alloy Steel”.
Sustained Construction Demand: The cement sector’s output also posted steady growth. The “Manufacture of other non-metallic mineral products” category (which includes cement) expanded by 4.3% (YoY).
Investment Link Confirmed: This production growth is being directly absorbed by strong investment and infrastructure activity. The IIP’s Use-Based classification showed that Infrastructure/Construction Goods output grew by a robust 10.5% (YoY).
Other Key Drivers: Other major manufacturing groups contributing to the IIP’s 4.8% growth included the “Manufacture of electrical equipment” (+28.7%) and “Manufacture of motor vehicles” (+14.6%).
In Detail -
STEEL SECTOR: INDICATORS OF ACCELERATED DEMAND
The steel sector was the standout performer within manufacturing in September 2025. Output in the “Manufacture of basic metals” category surged by an impressive 12.3% year-on-year, confirming strong momentum across capital goods and infrastructure construction.
The production figures reflect this strength across the value chain. The IIP press release specifically highlights that growth was driven by key inputs for construction and heavy industry, including “MS slabs”, “HR coils and sheets of mild steel”, and “Flat products of Alloy Steel”.
This high production is being met by strong immediate demand, rather than just inventory build-up. This is confirmed by the IIP’s Use-Based data, which shows that the Infrastructure/Construction Goods segment posted a powerful 10.5% (YoY) growth. This indicates that the increased steel production is flowing directly into ongoing public and private sector projects.
CEMENT SECTOR: SUSTAINED CONSTRUCTION MOMENTUM
Cement output growth in September reaffirms the sustained positive trend in both housing and large-scale infrastructure construction. The “Manufacture of other non-metallic mineral products” category, which is dominated by cement, expanded by 4.3% (YoY).
This growth in cement, combined with the surge in steel production, provides a clear and consistent picture of the economy’s investment-led expansion. The robust 10.5% (YoY) growth in the “Infrastructure/Construction Goods” index further validates that domestic demand from construction activities remains a primary engine of industrial output.
The data for September 2025 underline India’s emergence as a structurally resilient economy; one that has transitioned from cyclical recovery to durable, investment-driven expansion. The RBI’s policy pause, coupled with an upgraded growth outlook and sharply reduced inflation forecast, encapsulates a phase of macroeconomic stability rarely achieved amid global uncertainty. While industrial output and consumer demand reveal a two-speed dynamic, strong capital formation, expanding female workforce participation, and resilient fiscal performance provide assurance of underlying strength.
At the same time, widening trade deficits and service export softness caution against complacency, emphasizing the need to strengthen domestic competitiveness and diversify export capabilities. The National Pulses Mission and the Blue Economy strategy demonstrate a pivot toward structural transformation fostering food security, reducing import dependency, and unlocking new frontiers for employment and value creation.
Ultimately, India’s growth pulse in October 2025 reflects an economy confidently positioned for sustained momentum: disciplined in policy, adaptive in structure, and ambitious in reform. The coming quarters will test how effectively these gains are consolidated into long-term resilience and broad-based prosperity.