

The June 2025 edition of the Sectoral and Economy Tracker provides a data-driven overview of India’s macroeconomic and sectoral performance. Drawing on updates from the Ministry of Statistics and Programme Implementation (MoSPI), the Reserve Bank of India (RBI), the Ministry of Finance, S&P Global, and other relevant sources, the report outlines developments in growth, inflation, trade, financial stability, fiscal performance, and employment, alongside trends in key sectors such as agriculture, fisheries, coal, renewable energy, and steel.
The month’s data reflects a mixed outlook. While headline inflation reached historic lows, industrial production and GST revenue growth slowed, highlighting concerns about demand momentum. The external sector registered a narrower trade deficit, supported by strong services exports, even as merchandise trade remained in deficit. Monetary policy has continued on an easing trajectory, with repo rate reductions supporting liquidity, though structural challenges in investment and rural-urban demand remain visible.
On the sectoral side, agriculture benefitted from above-normal monsoon conditions and timely increases in Minimum Support Prices (MSPs), while fisheries exports gained from a new trade agreement with the United Kingdom. Coal production and dispatches reflected efficiency improvements and lower import dependence, but renewable energy surpassed 50% of total installed power capacity, marking an important shift in India’s energy mix. Steel output continued to grow robustly, supported by domestic demand, though export weakness persists.
This edition, therefore, captures the detail of macroeconomic moderation alongside structural progress in energy and industrial capacity, underscoring the need for calibrated policy responses to sustain growth momentum while advancing long-term resilience.
The article is divided into 2 sections :
Economic Snapshot - Covering over all key macro indicators of India.
Sectoral Updates - Covering all the key sectoral updates such as Manufacturing, MSMEs and key verticals.
I. Economic Snapshot -
This section presents an overview of our economic performance as of June 2025, based on the latest data from the Ministry of Statistics and Programme Implementation (MoSPI), the Reserve Bank of India (RBI), the Ministry of Finance, S&P Global, the Ministry of Commerce and Industry and other relevant Ministry. (Refer To Annexure I For Detailed Analysis)
A. Growth and Output
Industrial Growth Slumps to 10-Month Low of 1.5% in June 2025 With Core Sectors Slowing Down
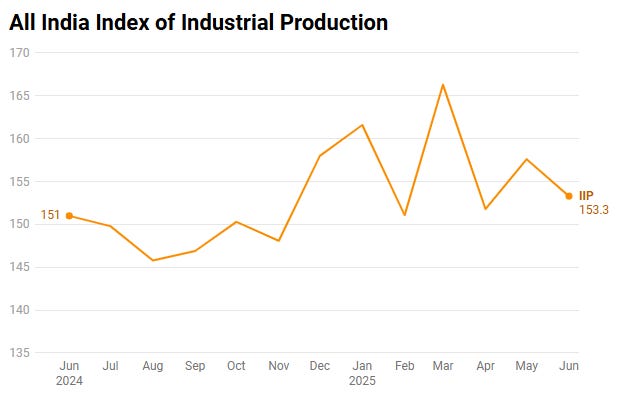
Amongst the three major sectors, only manufacturing showed a modest improvement, with output rising 3.9% in June. However, the overall Index of Industrial Production (IIP) reflects a sharp divergence in comparison to the 4.9% growth seen in June 2024. This slowdown driven by sharp contractions in mining (-8.7%) and electricity (-2.6%), is likely to dampen GDP growth, potentially missing the RBI’s 6.5% FY 2025-26 target and straining fiscal resources. Weak capital goods (3.5%) and consumer durables (2.9%) growth signal reduced private investment and urban demand, stalling job creation. Additionally, the contraction in consumer non-durables (-0.4%) may weaken household spending, further slowing retail activity and increasing pressure on policymakers to stimulate the economy.
B. Inflation and Price
Consumer Price Index (CPI) Cooled To A 77-Month Low Of 2.10% In June 2025, Driven By Sharp Drop In Food Inflation To -1.06% And Wholesale Price Index (WPI) Declined To -0.13%
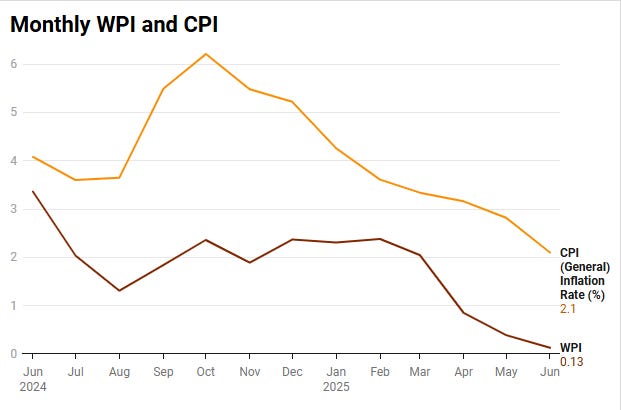
The sharp decline in both CPI (2.10%) and WPI (-0.13%) in June 2025, alongside negative food inflation (-1.06%), is largely positive, as lower food prices ease costs for consumers and businesses. However, sustained negative inflation paired with falling real wages could reflect weakening consumer demand, potentially undermining economic growth. This low-inflation environment supports the Reserve Bank of India’s recent interest rate cuts and opens the door for further rate cuts in the future to stimulate growth without causing too much price rise.
C. Trade and External Sector
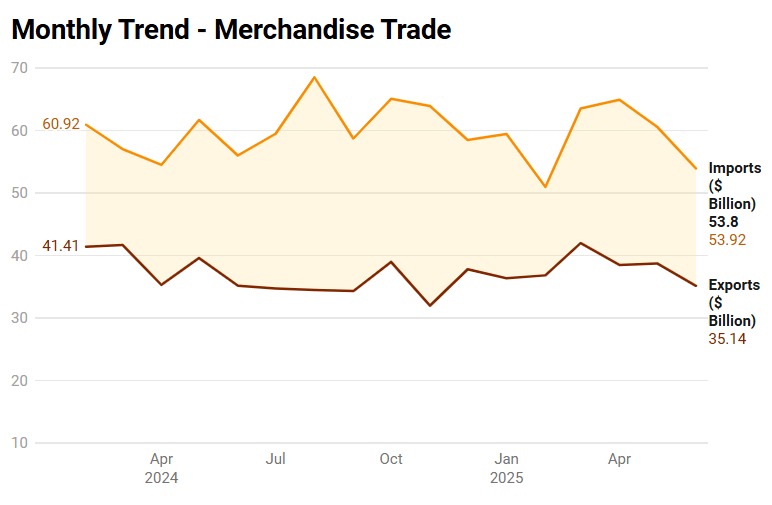
The Merchandise Trade Deficit Decreased By 14.20% To $18.8 Billion In June 2025 From $21.9 Billion In May 2025
The Service Sector’s Performance Has Been Strong, Driven By $ 32.84 Billion In Exports, And Was The Primary Anchor In Reducing The Overall Trade Deficit To $ 3.51 Billion, A Substantial Improvement From $ 7.30 Billion In June 2024
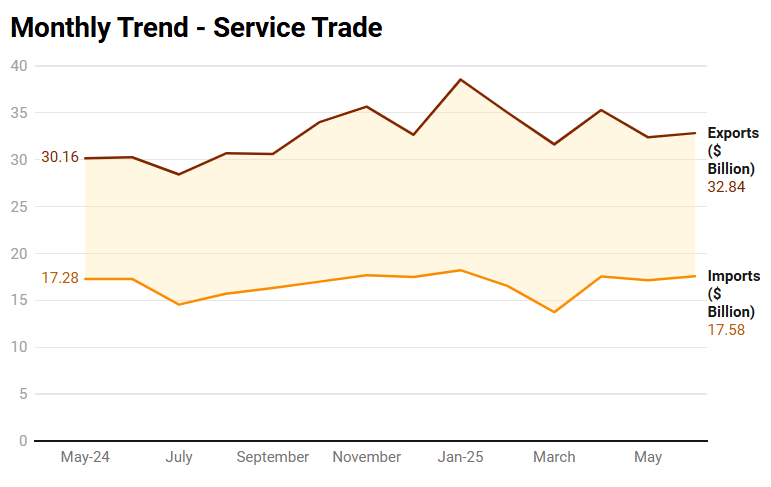
The reduced merchandise trade deficit and strong service sector exports are helping to stabilize the country’s external finances, potentially strengthening the rupee and boosting foreign exchange reserves. This improved trade balance may attract foreign investment, supporting economic growth, but persistent merchandise trade deficits could strain long-term current account sustainability. The service sector’s strength creates opportunities for job growth in IT, finance, and other services, though relying only on services may deepen sectoral imbalances if manufacturing remains weak. Additionally, a narrower trade deficit could reduce pressure on Government spending, allowing the Government to allocate resources to infrastructure and social programs.
D. Financial Health
The 10-Year G-Sec Yield Declined Steadily From Over 7.2% In Mid-2023 To 6.27% By Mid-2025. The RBI Repo Rate Was Reduced In June 2025, Reaching 5.5% And Signaling An Easing Monetary Policy
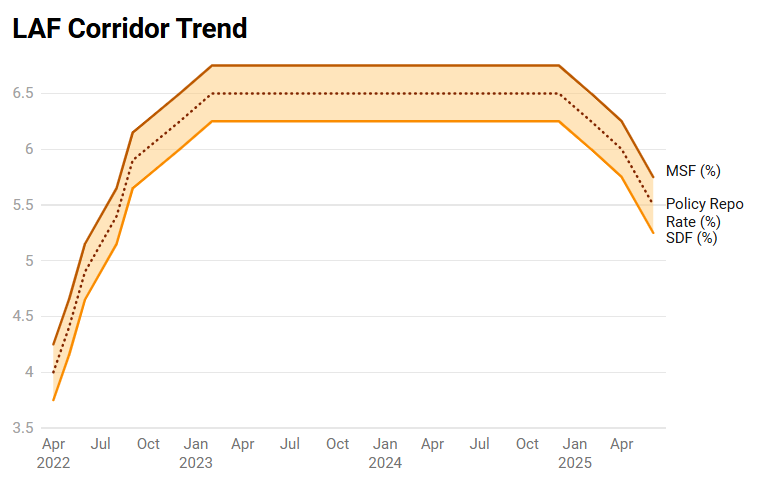
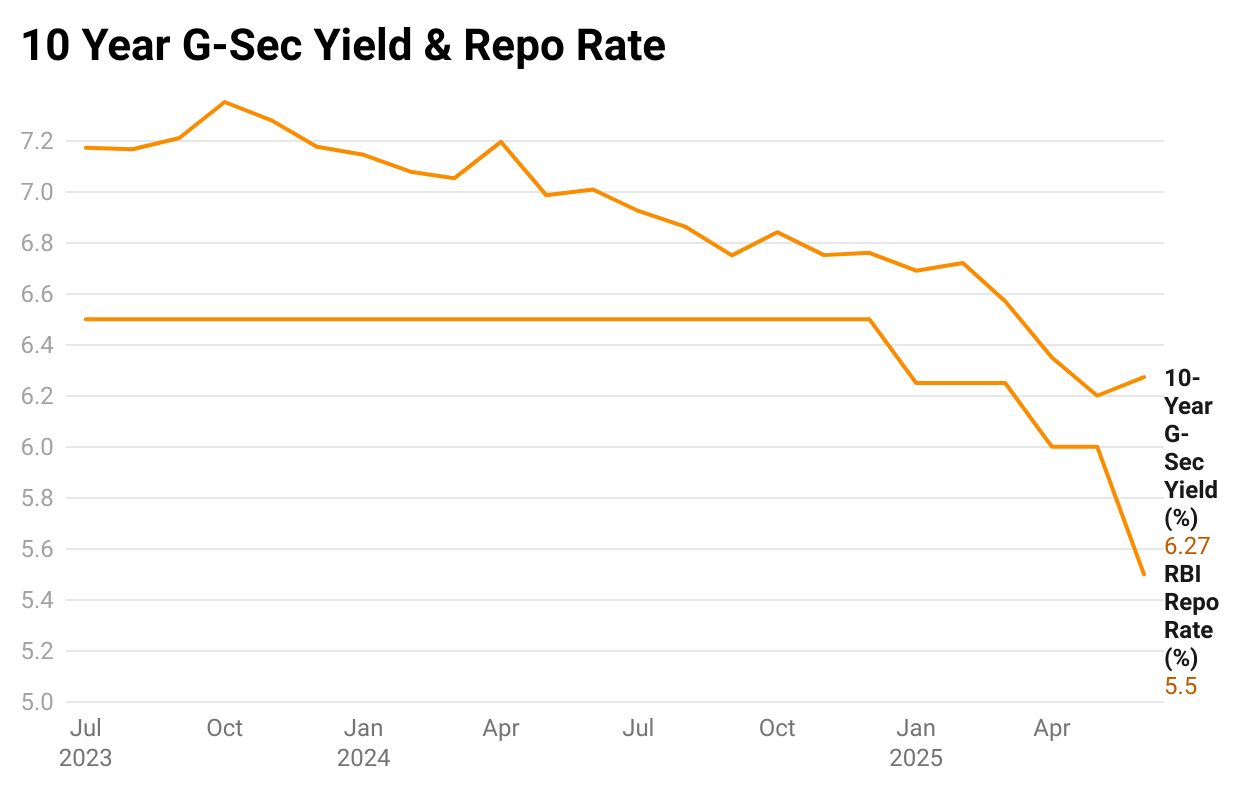
The decline in G-Sec yields and the repo rate cut to 5.5%, supported by a downward-adjusted Liquidity Adjustment Facility (LAF) corridor, increases liquidity in the banking system, enabling cheaper borrowing and boosting credit demand, investment, and consumption, which may accelerate GDP growth. However, this enhanced liquidity could inflate bond and equity prices, risking asset bubbles, while sustained easing may elevate inflationary pressures, challenging the RBI’s price stability objectives.
E. Fiscal Health
GST Collections Rise To ₹ 1.85 Lakh Crore in June 2025; YOY Growth Slows To Four Year Low Of 6.2% Amid Subdued Domestic Revenue, While Q1 Collections Maintains Double-Digit Momentum
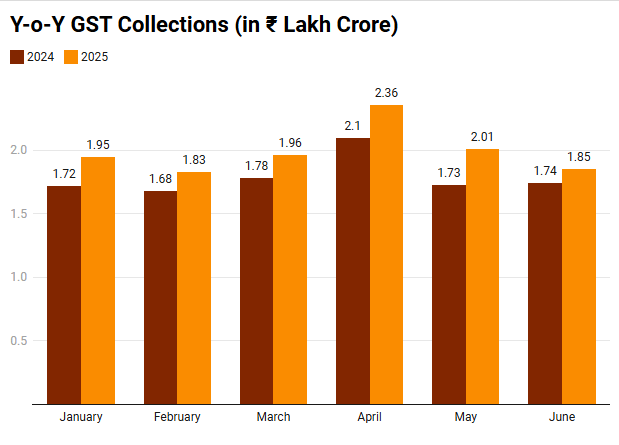
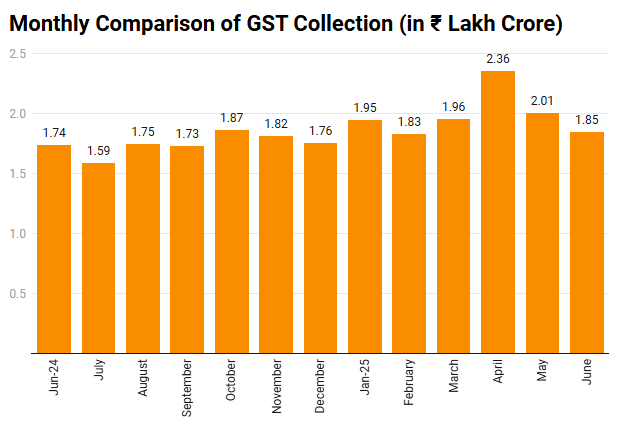
GST collections for June 2025 stood at ₹ 1.85 Lakh Crore in June 2025, a modest 6.2% uptick over the previous year (slowest YOY growth in four years), as softening of demand moderated the rise in collections following robust start to the fiscal year. Notably, the average monthly net GST collection in Q1 of FY 2025-26 rose to ₹1,80,774 crore, 10.7% higher than the Q1 average of the previous year, underscoring sustained momentum in Government revenues and economic activity.
F. Labour and Employment
Labour Force Participation Rate (LFPR) Declines to 54.2%, Worker Productivity Rate (WPR) to 51.2%, While Unemployment Rate Holds At 5.6% - Driven By Seasonal Agricultural Patterns, Shift of Unpaid Helpers To Domestic Chores
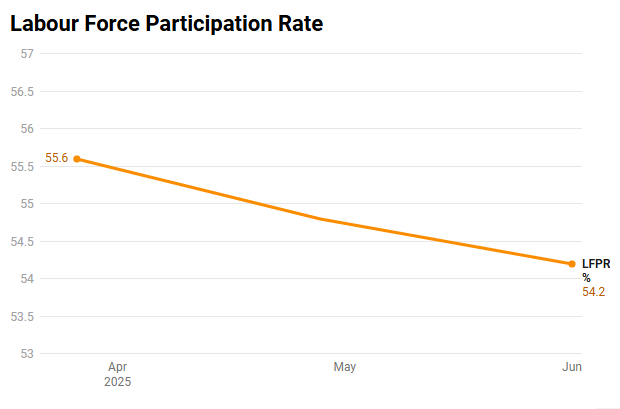
The LFPR and WPR both saw a marginal decline, influenced primarily by seasonal agricultural patterns and a shift of some unpaid helpers towards domestic chores. Despite this slight drop in participation rates, the unemployment rate remained steady at 5.6%, unchanged from May 2025. This stability, especially in rural employment, can be attributed to an increase in the share of self-employed workers in June 2025 compared to May 2025, along with a reduction in the number of unemployed persons.
II. Sectoral Snapshot -
This section presents an overview of our performance in key sectors as of June 2025, based on the latest data from the Ministry of Agriculture and Farmers Welfare, Ministry of Fisheries, Animal Husbandry and Dairying, Ministry of Road, Transport and Highways, Ministry of New and Renewable Energy. (Refer To Annexure II For Detailed Analysis)
A. Agriculture
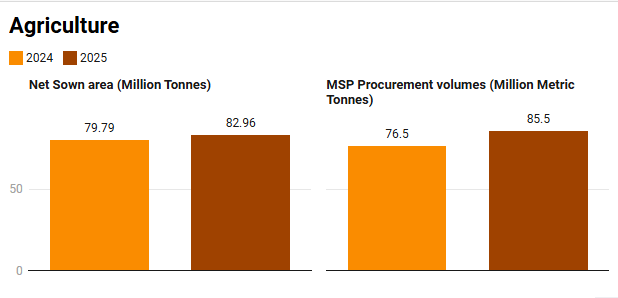
Net Sown Area Under Kharif Crops Touched 82.96 Million Hectares, Whereas The Minimum Support Price (MSP) Procurement Volume Reached 85.5 MT.
I. Key Updates:
A. Agriculture -
Increase in Net Sown Area: As of 25th July, 2025, the ongoing sowing season has been robust so far with a total of 82.96 million hectares sown, a 4% increase compared to 79.79 million hectares during the same period last year. Notably, Paddy has shown the most significant expansion.
Above Normal Monsoon: The monsoon season that started from 1st June, 2025, has registered a 7% surplus for the season (till July, 2025). During this time, the country received 447.8 mm of rain against a normal of 418.9 mm, however with large variations between regions. This early and robust monsoon bodes well for Kharif sowing and future agricultural output, reinforcing the positive inflation outlook.
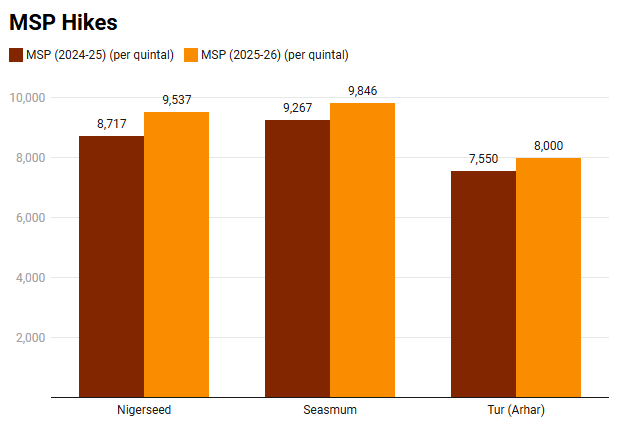
Hike in MSP: The Minimum Support Price (MSP) increases for Kharif crops for the 2025-26 marketing season, with notable hikes such as ₹ 820 per quintal for Nigerseed, ₹ 579 for Sesamum, and ₹ 450 for Tur (Arhar).
II. Implications -
The increase in the net sown area underscores timely monsoon support and increased farmer confidence. But, falling soybean and cotton acreage may impact agri-markets in the coming months.
The monsoon plays a vital role in the agriculture sector, which sustains around 42% of the population and contributes 18.2% to the GDP. The deficient monsoon predictions by the Indian Meteorological Department (IMD) for states such as Punjab, Haryana, Kerala, and Tamil Nadu might be crucial as they may affect key crops such as rice, sugarcane, and cotton, potentially leading to lower yields and income for farmers.
In addition to increased rainfall, the recent MSP hikes for Kharif crops in the 2025-26 marketing season are expected to provide farmers with more remunerative prices while strategically aiming to reduce reliance on edible oil and pulse imports. This is particularly significant in states like Maharashtra, Gujarat, and Madhya Pradesh, where these crops are extensively cultivated, though the effectiveness may vary depending on local market dynamics and implementation challenges.
B. Fisheries
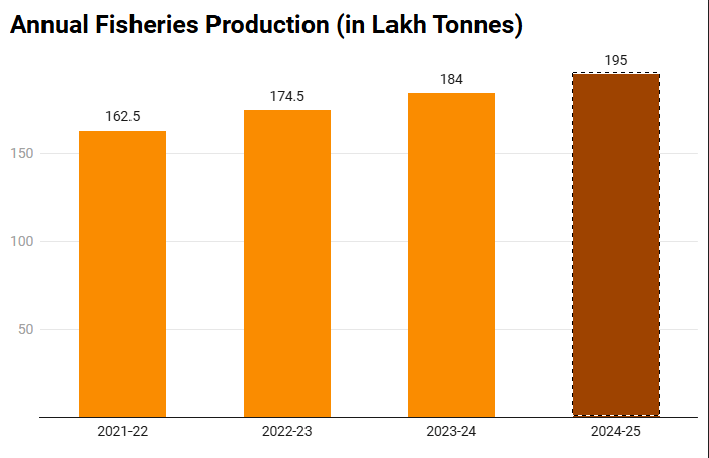
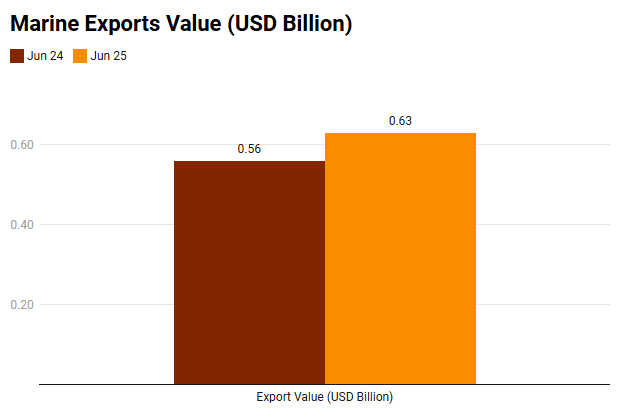
Fish Production Expected To Reach 195 Lakh Tonnes For FY 2024-25, Marine Exports Value Grew By 13.33% in June 2025 (Over June 2024).
I. Key Updates:
Marine Exports Growth: Marine product exports have shown positive momentum in the first quarter of FY 2025-26, where they rose by 19.45% to ₹ 16,233.75 crore. For YOY comparison, this increase was 13.33% from US $ 0.56 billion in June 2024 to US $ 0.63 billion in June 2025.
Foreign Policy Landmark Agreement: A significant development in July 2025, directly impacting future export trends, is the signing of the Comprehensive Economic and Trade Agreement (CETA) with the United Kingdom. This landmark agreement is expected to boost seafood exports to the UK by an estimated 70%, driven by the elimination of tariffs on 99% of tariff lines.
II. Implications :
The tariff elimination under CETA is expected to boost seafood exports in coastal states like Andhra Pradesh, Kerala, Maharashtra, and Odisha. Increased demand will spur job creation in processing and logistics, uplifting livelihoods, though benefits may vary based on regional infrastructure readiness.
By securing duty-free access to the UK’s premium seafood market, CETA enhances India’s position against competitors like Vietnam. This shift diversifies export markets, reducing reliance on traditional buyers, but places an increased emphasis on consistent quality improvements to meet global standards.
The export surge will encourage investments in cold chain and processing facilities in states like Gujarat and Tamil Nadu, fostering rural economic development. However, smaller exporters may struggle with compliance costs, necessitating Government support to ensure inclusive growth.
C. Coal
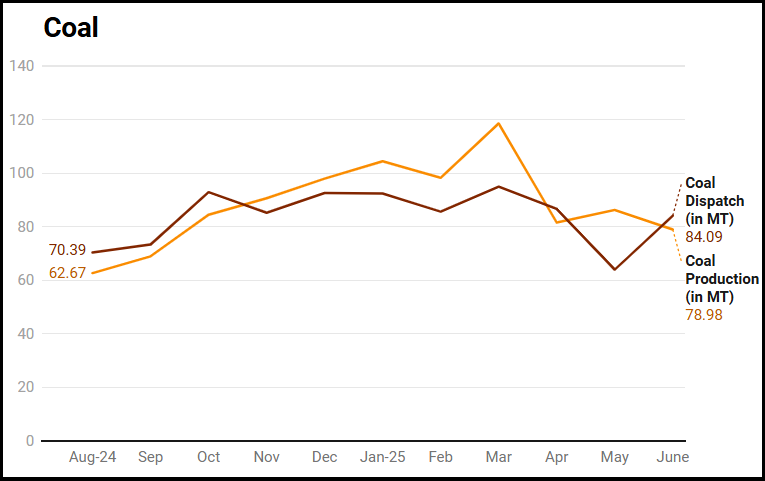
Coal Output Touched 78.98 MT In June 2025, Dispatch Stands At 84.09 MT.
I. Key Updates :
Increase in Total Stock: The total coal stock maintained by various coal companies reached 117.01 million tonnes (MT) as of June, 2025. This figure represents a substantial increase of 25.7% when compared to the 93.04 MT recorded during the same period in the previous year.
Captive and Commercial Mines Production Growth: A total of 15.57 million tonnes (MT) of coal was produced in June 2025 from Captive and Commercial Mines, which represents a significant year-on-year growth of 16.39% compared to June 2024.
Captive and Commercial Mines Dispatch Growth: A total of 17.31 million tonnes (MT) of coal was dispatched from Captive and Commercial Mines in June 2025, surpassing last year’s dispatch for the same period. This marks a 13.03 % increase compared to June 2024.
II. Implications:
The first quarter of the financial year 2025–26 showed strong year-on-year growth, with both production and dispatches increasing, as compared to the same period last year. This reflects improved efficiency and better utilization of mining capacity.
The total number of coal blocks allocated by the Ministry of Coal now stands at over 200. This increase ensures uninterrupted supply of coal to sectors like power generation, steel manufacturing and cement production.
The fall in coal imports saved a significant amount in foreign exchange. This reduces pressure on the Trade deficit. In addition, imports for thermal power blending dropped sharply by 41.1%, despite a rise in coal-based power generation. This highlights the ongoing efforts to reduce its dependence on imported coal and enhance self-sufficiency in coal production.
The International Energy Agency has projected that domestic coal production is going to increase significantly, which will make coal imports drop down to 219 MT, and thermal coal imports down to ~150 MT.
D. Renewable Energy
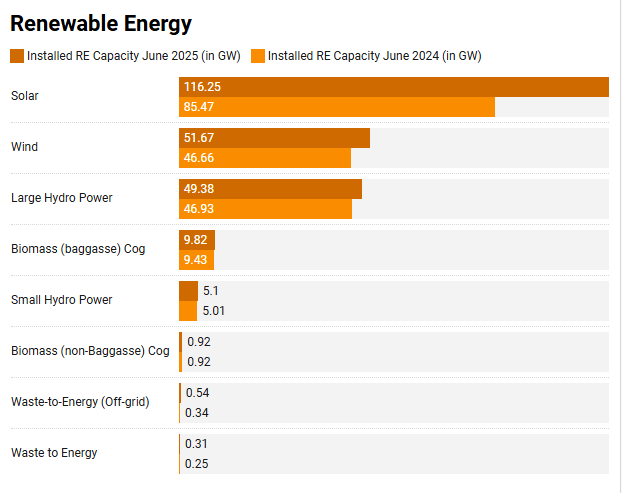
Non-Fossil Fuel Sources Now Contribute More Than 50% To The Installed Power Capacity.
I. Key Updates:
Renewable Energy Takes A Lead In Increased Power Generation Capacity: In Q1 of FY 2025- 26, a total of 14.2 GW was added to power generation capacity, bringing the total installed power generation capacity to 476 GW by June 2025. Of this, non-fossil fuel account over 50% (as of 13th July, 2025), reflecting the country’s accelerating shift toward clean and sustainable energy.
Rise in Total Solar Capacity: Total Solar Capacity Surged to 116.25 GW in June 2025 (Up From 110 GW In May 2025), wind capacity to 51.68 GW and hydro capacity to 54.48 GW. This includes 226.9 GW renewable and 8.8 GW nuclear.
II. Implications:
In Q1 FY 2025-26, renewables dominated the additions, with over 93% of April–May capacity coming from clean sources, and June 2025 entirely from renewables. With non-fossil fuels crossing 50%, coal plants may face reduced PLFs (plant load factors), pushing Distribution Companies (DISCOMs) to renegotiate Power Purchase Agreements (PPAs) or accelerate coal unit retirements, potentially stranded assets.
This rapid rise in renewable capacity will strain grid infrastructure, necessitating urgent investments in storage (batteries/pumped hydro) and smart grid tech to manage intermittency and avoid wasting excess power. Furthermore, solar’s sharp growth hints at rising demand for modules, inverters, and balance-of-system components, benefiting local manufacturers.
The pace of renewable additions (14.2 GW in a quarter) could expose land acquisition and environmental clearance delays, especially for wind/hydro, requiring policy tweaks to sustain momentum.
F. Steel
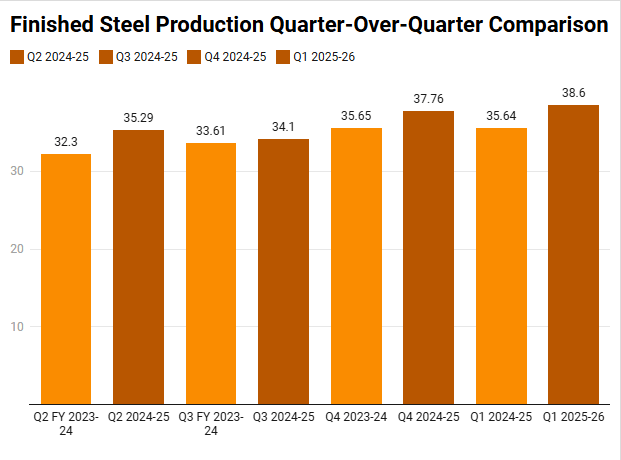
Finished Steel Production During April–June 2025 (Q1 Of FY 2025-26) Stood At 38.6 Million Tonnes, Marking An 8.6% Year‑on‑year Increase Over The April–June 2024 Period
I. Key Updates:
Growth In Production: Crude steel production for the period April - May stood at 26.9 MT in finished steel during April–May, reflecting a 9.5% year‑on‑year growth in consumption and output. Finished steel production reached 38.6 MT.
Fall In Steel Imports: During April–May 2025, finished steel imports fell sharply to 0.90 MT, marking a 27.6% year-on-year decline, largely due to a sharp drop from China and Japan. The imports during Q1 FY 2025-26 totalled approximately 1.412 MT, down nearly 28% year-on-year, driven primarily by the newly imposed safeguard duty and competitive pricing from domestic producers. However, combined imports for the period April–June were approximately 1.412 MT, which represents a 27.4% drop from 1.944 MT during April–June 2024.
India Remains A Net Importer: Exports totaled approximately 1.213 MT, which is 5.1% lower than 1.278 MT exported in April–June 2024. The decline in exports reflects weak global demand, competition from China, and trade uncertainties, although shipments to the EU performed relatively better in April.
II. Implications :
The year-on-year growth in crude steel production and finished steel output reflects robust domestic manufacturing capacity. This growth, particularly in states like Jharkhand, Odisha, and Chhattisgarh, supports industrial development and job creation.
The 27.4% drop in finished steel imports, driven by a 12% safeguard duty, enhances self-reliance in the steel sector. This benefits domestic producers but may increase costs for industries reliant on specialized imported steel.
Increased domestic production aligns with the goal of achieving 255 MT of crude steel by 2030, bolstering economic resilience. However, sluggish demand and falling rebar prices, particularly in regions with high production like Odisha, could limit profitability for smaller producers.
Lower imports and higher production position India as a stronger player in the global steel market, supporting exports to countries like Belgium. Yet, reliance on imported metallurgical coal and fluctuating global tariffs may pose cost-related challenges.
Annexure I - Economic Updates in Detail
I. Key Highlights -
PMI: The manufacturing sector expanded, with the Manufacturing Purchasing Managers’ Index (PMI) rising to 58.4 in June 2025 (averaged 58.2 during the quarter) as compared to 57.6 in May, reaching a 14-month peak and Services PMI hit a 10-month high of 60.4 and averaged 59.3 during the quarter. This was supported by improvement in orders and increase in employment. Export orders in June 2025 witnessed the sharpest increase since the survey began, hinting towards enhanced export demand. Input and output prices continued to rise for both manufacturing and services firms.
IIP Slowdown: The industrial output growth fell to a 10-month low of 1.5% in June 2025, down from 4.9% a year earlier, due to weak performance in mining (-8.7%), electricity (-2.6%), and consumer goods manufacturing, worsened by an early monsoon and uneven demand. While construction sectors saw slight growth, consumer non-durables (-0.4%) struggled, reflecting low urban spending. Strong metal and petroleum subsectors offered some support, showing resilience despite broader economic challenges.
II. Implications:
The slowdown in industrial output growth to 2% in Q1 FY 2025-26, down from 5.4% in Q1 FY 2024-25, driven by weak mining and electricity sectors, may dampen GDP growth and strain fiscal resources. This could limit infrastructure spending and private investment.
India’s Index of Industrial Production (IIP) for June 2025 shows a sharp sectoral divergence, with manufacturing output rising 3.9% year-on-year, supported by gains in pharmaceuticals, food products, and transport equipment, while mining plunged by 8.7% and electricity fell 2.6%. Compared to June 2024’s 4.9% overall growth, the slowdown is pronounced, especially in core segments that drive upstream and downstream activity. Capital goods grew only 3.5% (vs. 9.4% last year), consumer durables rose 2.9% (vs. 8.1%), consumer non-durables contracted 0.4%, and infrastructure/construction goods slowed to 4.1% from 11.3%, signalling stress in investment, consumption, and construction activity.
If these trends persist, the industrial sector, which contributes roughly a quarter of GVA, could shave 0.5–1 percentage points off GDP in FY 2025-26, pulling growth below the RBI’s 6.5% target to around 5.5–6.0%. The fiscal impact could include a ₹30,000–₹60,000 crore shortfall in tax revenues from lower corporate profits, GST collections, and mining royalties, alongside greater pressure for counter-cyclical spending. Weak capital goods output and muted consumer demand may also stall job creation in manufacturing, mining, retail, and associated services.
The subdued IIP growth in Q1 FY 2025-26 also constrains the Monetary Policy Committee’s ability to implement aggressive rate cuts, demanding a monetary easing strategy to stimulate growth while mitigating inflation risks. This slowdown risks stalling economic momentum, requiring the RBI to carefully balance policy measures to address potential inflationary pressures and global economic vulnerabilities.
To prevent a deeper slowdown, policy focus needs to shift towards reviving mining through faster clearances, stimulating electricity demand via industrial linkages, and boosting consumption with targeted GST cuts and rural income support. Accelerating public capex in infrastructure and construction can help lift demand for capital goods, while measures to strengthen rural non-durables consumption would support retail momentum.
While construction and capital-intensive sectors show durability, stagnation in demand for consumer non-durables and rural-linked goods suggests a cautious consumption environment, which can also be inferred from the Household Consumption Expenditure Survey 2023-24. Rural consumption is rising faster than urban (9.2% vs. 8.3% MPCE growth), showing steady rural demand even amid urban caution. This narrowing gap suggests muted urban non-durable consumption but strong rural spending on essentials and services.
B. Inflation and Price
I. Key Highlights :
Lowest YOY CPI Inflation after January 2019: Consumer Price Index (CPI) inflation significantly cooled to 2.10% in June 2025, marking its lowest level since January 2019. This is in line with the inflationary rate of 2.82% in May 2025, and marks a sharp decline from 5.08% in June 2024, demonstrating the Government’s successful efforts in price stability.
Drop in Food Prices: Food inflation fell to -1.06% in June 2025, down sharply from 0.99% in May 2025 and 9.36% in June 2024, driven by a favorable base effect where a high inflation rate in June 2024 (the base period) makes the current price decline appear more pronounced.
Wholesale Price Decline: The Wholesale Price Index (WPI) inflation for June 2025 recorded a decline of -0.13%, primarily driven by lower prices in food articles, crude oil, and petroleum products, offering further relief on the cost front. The month-on-month growth rate for June 2025 stands at -0.19%.
Rise in Core Inflation: Core inflation increased to 4.40% in June 2025 (compared to approximately 4.30% in May 2025 and 3.1% in June 2024), demonstrating that underlying price pressures remain well within manageable limits,but poses an expectation of price rise in the future. This provides the Reserve Bank of India with greater flexibility for pro-growth monetary policies. However, retail core inflation excluding gold and silver stood at a comparatively lower 3.5%, suggesting that precious metals, which also have an investment demand, exerted upward pressure on the broader core inflation metric. If one were to exclude the petrol and diesel prices by treating them as a component of the volatile fuel group, then inflation inches down to 3.2%.
II. Implications :
Lower CPI and food inflation enhance household disposable income, boosting consumption, particularly among low-income groups, but sustained negative food inflation may signal weak demand, risking economic slowdown.
Low CPI and WPI inflation, despite rising core inflation (4.40%), allow the RBI to pursue pro-growth policies, such as rate cuts from the 5.5% repo rate, though caution is needed to monitor future price pressures.
The negative food inflation (-1.06%) and WPI decline (-0.13%) are largely driven by a favorable base effect and lower prices for food and petroleum could exert downward pressure on farmers’ and producers’ incomes especially when input costs remain high, potentially influencing investment in agriculture. While these trends may provide short-term relief for consumers, they could also affect the profitability of agricultural enterprises and create an uneven recovery between urban and rural economies.
it may be prudent to link policy responses such as upcoming Minimum Support Price (MSP) adjustments more closely to real-time inflation trends and crop-specific distress signals. Targeted MSP revisions, coupled with direct income or procurement support in vulnerable commodities, could help stabilise farm incomes without creating excessive inflationary pressures.
Low inflation supports short-term consumption, but weak demand and industrial output (2% in Q1 FY 2025-26) may hinder GDP growth, straining fiscal resources and requiring balanced RBI policies to avoid deflationary risks.
C. Trade And External Sector
I. Key Highlights -
Overall External Performance Improves: The total exports registered a 6.5% year-on-year growth, reaching ₹ 5.83 Lakh Crore in June 2025. They have registered a growth rate of 5.9% (YOY) in Q1 FY 2025-26, reaching ₹ 18,406.26 crore (merchandise export up by 1.9% and services export by 10.9%). Concurrently, total imports moderated to $ 71.5 billion.
Services Trade Surplus Bolsters External Accounts: A robust services trade surplus of an estimated ₹1,27,160 crore in June 2025 significantly reduced the merchandise trade deficit, which narrowed to ₹1,56,860 crore from ₹1,83,080 crore in May. This strong services performance, driven by ₹2,74,700 crore in exports, was the primary reason for the reduction in the overall trade deficit (merchandise and services combined) to ₹29,350 crore, a substantial improvement from ₹61,000 crore in June 2024 (Deficit reduced by 9.4% compared to Q1 FY 2024-25). In addition, air cargo volumes rose steadily, registering an 8.1% YOY increase in April-May 2025. Cargo handled at major ports also remained on a firm growth path, expanding by 5.6% in Q1 of FY 2025-26.
Merchandise Trade Still in Deficit: Core merchandise exports continued to grow strongly by 7.2% (YOY), mainly driven by electronic goods that have grown by 47.1% (YOY). Petroleum products exports fell starkly by 15.6% (YOY) during Q1 FY 2025-26. Similarly, merchandise imports have increased by 4.2% (YOY); petroleum, crude and products imports fell by 4.4% (YOY). This reduction is likely attributable to the softening of the average Crude Oil FOB Price (Indian Basket), which has decreased to $ 67.2 per barrel in Q1 FY 2025-26 from $ 85.2 per barrel in Q1 FY 2024-25. Still, the current position is that of a Merchandise Trade deficit.
II. Implications :
Overall exports have increased, reflecting a judicious approach to external demand management and contributing to a healthier external balance. This helps in reducing our Trade deficit, which is majorly altered through the export of services.
Strong growth in electronic goods is boosting overall merchandise exports despite a sharp decline in petroleum exports. However, falling crude oil prices have reduced petroleum import bills, moderating overall import growth.
Both exports and imports of merchandise fell significantly, indicating a possible slowdown in global and domestic demand. The sharper drop in imports led to a narrower merchandise trade deficit, easing pressure on the current account. Stable services trade surplus suggests resilience in the services sector, offsetting some of the goods trade weakness.
The marginal rupee depreciation may slightly raise import costs but has limited impact on overall economic stability.
D. Financial Health
I. Key Highlights
Constant Policy Repo Rate: PRR was kept at 5.50% stressing on the significance of stability in the economy.
Systemic Financial Stability: Despite a moderation in bank credit growth to 9.5% YOY, There have been stable 10-year G-Sec yields, strong deposit growth (10.3% YOY), and steady credit expansion (~9.5%) in Q1 FY 2025-26.
A Dip in Credit Growth of SCBs: As of 27th June, 2025, the YOY credit growth of the Scheduled Commercial Banks (SCBs) has moderated to 10.4%, a decrease from 13.9% recorded a year ago. This has resulted in the credit-deposit ratio of 77.4%, similar to what was observed in June 2024.
Liquidity Management & Rate Stabilization: The RBI’s infusion of ₹ 50,000 crore via a two-day variable rate repo (VRR) auction effectively addressed the surge in the weighted average call rate (WACR) to 6.78%, which was above the marginal standing facility (MSF) rate of 5.75%.
II. Implications :
Maintaining the policy repo rate at 5.50% prioritizes macroeconomic stability, fostering investor confidence and supporting industrial expansion in states like Maharashtra and Gujarat. In addition, stable 10-year G-Sec yields, robust deposit growth of 10.3% YoY, and consistent credit expansion at 9.5% in Q1 FY 2025-26 reflect systemic financial strength.
The 9.5% YoY credit expansion and 10.3% deposit growth in Q1 FY 2025-26 reflect a resilient banking system, channeling funds to industries. However, moderated credit growth to 10.4% YoY for SCBs signals cautious lending, potentially slowing infrastructure investments.
The RBI’s VRR auction stabilized the weighted average call rate at 6.78%, ensuring smooth trade financing in financial hubs like Mumbai. Ongoing liquidity interventions, however, highlight vulnerabilities that could affect investor confidence in volatile markets.
E. Fiscal Health
I. Key Highlights:
Decline in Growth MOM: The 8% decrease in June comes after two back-to-back months of over ₹ 2 lakh crore collection in April and May. The growth in GST revenue dropped to low single digit in June which is the slowest, as compared to April and May. The net GST collection (collection after refund deductions) during the month was even worse, growing at 3.3% to ₹ 1.59 lakh crore, as refunds grew by 28.5%.
Growth Rate Dropped from May YOY: The 6.2% year-on-year rate of growth in June 2025 GST collections dropped to a single digit, from the earlier 16% growth rate during May 2025 (compared over May 2024).
CAPEX Increased: In 2024-25, capital expenditure was ₹ 10.52 lakh crore, surpassing the revised estimates (₹ 10.18 lakh crore). The quality of expenditure, measured as the ratio of capital expenditure to revenue expenditure, has remained higher than 0.27 for the past three years, almost double the pre-COVID average.
Fiscal Deficit Improved: Reduced by 0.74% of GDP to 4.77% of GDP in 2024-25. During April-May 2025, the fiscal deficit is 0.8% of the 2025-26 budget estimates.
II. Implications :
Decline in the growth rate of GST collections was primarily due to low mop-up from domestic transactions, indicating moderation in economic activities. When compared over June 2024, the GST collections showed a moderate growth, but the growth rate has dropped significantly as compared to the increase witnessed in May 2025 from May 2024. This shows lowered transaction velocity and suggests softening consumption and investment trends.
Actual Capex surpassing the Revised estimates showcases good utilisation of funds, and in addition to this, higher Capex spending is anticipated by States. But, if the GST collections growth rate drops even further, it might lead to expenditure cuts or higher borrowings by the Government in the future.
The Fiscal Deficit Target improved, well in line with the Fiscal Responsibility and Budget Management Act. Continued rationalisation of revenue expenditure with increasing non-debt capital receipts, while sustaining capex, has enabled a faster and more effective fiscal consolidation.
F. Labour and Employment Indicators
I. Key Highlights :
Decline in Labour Force Participation Rate (LFPR): There was a marginal decline in LFPR to 54.2% and WPR to 51.2%. UR remained the same as 5.6% in June, 2025.
Share of Women in Rural Employment: The share of rural women employed in agriculture fell from 70.2% in May to 69.8% in June 2025.
II. Implications :
The decline in LFPR and WPR was influenced by seasonal agricultural patterns, intense summer heat limiting outdoor physical work, and a shift of some unpaid helpers, particularly from higher-income rural households, towards domestic chores.
Percentage of women in agriculture reduced, suggesting that women had less need to work in agriculture, maybe as a result of lower rural inflation (as rural living costs dropped).
Annexure II - Sectoral Updates In Detail
A. Agriculture & Allied
I. Key Highlights :
Expansion in Sown Area: As of 25th July, 2025, the total sown area for Kharif crops has reached 82.96 million hectares, marking a 4% increase compared to the 79.79 million hectares reported for the same period in 2024.
Steady Growth in Marine Exports: There was a marginal rise in Marine Exports with a strong growth recorded at ₹ 16,858 crore in Q1. The US led the demand with a 37.63% share, followed by China (17.26%), Vietnam (6.63%), Japan (4.47%), and Belgium (3.57%).
Growth In Annual Seafood Exports: Total seafood exports in 2024–25 reached $ 7.2 billion (₹ 62,625.09 crore), amounting to 1.78 million metric tonnes. Frozen shrimp remained the top export, accounting for 66% of earnings with $ 4.88 billion. With CETA now in force, industry estimates project a 70% surge in marine exports to the UK in the coming years.
B. Energy and Power :
a. Electricity and Power Generation -
I. Key Highlights :
Total Installed Power Capacity: It reached a significant 476 GW. This includes a growing share from non-fossil fuel sources, which now account for more than 50% of the total installed capacity, signalling a deliberate move towards Clean Energy.
Sharp Rise in Electricity Generation: Electricity generation surged to 44,549 crore units in Q1 2025-26, up significantly from 31,300 crore units in Q4 2024-25, indicating strong seasonal demand and improved supply.
Decline in Peak Demand Met: Peak power demand marginally declined (-0.57%). The Peak Power Demand Met saw a decrease to 242.5 GW during June 2025, from 244.52 GW in May 2025, suggesting a temporarily weakened demand, majorly due to early onset of monsoon and lesser usage of cooling appliances.
b. Coal -
I. Key Highlights :
Overall Decline: A decline in MOM coal production and dispatch for June 2025 as opposed to May 2025. In addition to this, YOY figures also indicate a decrease of 6.8% over June 2024.
Slight Drop in Pithead Stock: Pithead coal stock declined by 4.6% to 117.01 MMT as of June 2025, indicating higher consumption likely driven by increased power generation.
c. New & Renewable Energy -
I. Key Highlights :
Rise in Renewable Generation and Capacity: Renewable power generation increased by 18% in June 2025 to 2599.5 crore units (from 2202.8 in May), while installed renewable capacity saw an exponential increase to a whopping 7,284 MW (~325% increase) as compared to 1,707 in May 2025. The surge was driven by accelerated project completions ahead of fiscal deadlines and improved policy support. This boost enhances grid decarbonization and strengthens energy security.
Strong Uptake in Solar Pump Installations under PM-KUSUM: The number of solar pumps installed under PM-KUSUM rose by 18.29% to 8,28,000 in June 2025, up from 7,00,000 in the previous period, reflecting a good adoption of solar technology for energy generation.
C. Manufacturing & Industrial Production
a. Steel -
I. Key Highlights :
Strong Production Growth: Steel production increased by 9.3% in June, 2025 over June, 2024. Out of this, Finished steel production increased by 12.5% for the same period. Taken together, during April-June 2025, finished steel production rose by 8.6% over April-June 2024. A total of 38.6 million tonnes of finished steel was produced during the three months ended June 2025.
Robust Consumption: Steel consumption grew by 7.9% year-on-year during April–June 2025, showing consistency with the seasonal trends associated with pre-monsoon activity in infrastructure and housing projects.
Sharp Decline in Exports: Steel exports dropped by 38% to 1.3 MT in Q1 2025-26 (from 2.1 MT in Q1 2024-25), reflecting a shift toward meeting domestic demand (estimated to be 12.5-13 MT) or weaker global competitiveness.
b. Cement -
I. Key Highlights :
Rise in Monthly Production and Consumption: Cement production rose by 2.75% in June 2025 to 39.6 MMTs, up from 38.54 MMT in May, indicating a temporary growth in construction activity or seasonal factors. Consumption also registered an increase of 7%, due to higher infrastructure spending and pre-monsoon construction activity. This supported industrial output and signaled robust investment demand in the economy.
Significant Capacity Expansion: Coupled with the production increase, installed capacity rose moderately by 1.45% to 700 MMT per annum in June 2025 (from 690 MMT in May), pointing to a significant infrastructure and industrial policy support.
III. Key Takeaways for the Month -
Economic Overview -
Growth & Output: Industrial growth slowed to 1.5%, a 10‑month low, primarily due to contractions in mining (-8.7%) and electricity (-2.6%). Manufacturing growth of 3.9% provided limited offset. The Index of Industrial Production (IIP) performance indicates weaker near-term GDP prospects relative to RBI’s 6.5% target for FY 2025–26.
Inflation: Headline CPI fell to 2.1%—a 77‑month low—while food inflation turned negative (-1.06%). Wholesale Price Index (WPI) decreased marginally (-0.13%). Core inflation rose to 4.4%, pointing to underlying price pressures, even as broader inflation trends remain benign.
Trade & External Sector: The merchandise trade deficit narrowed to $18.8 billion in June 2025, down from $21.9 billion in May, supported by a robust services surplus ($32.84 billion in exports). The overall trade deficit declined significantly compared to the previous year.
Financial Health: The repo rate stood at 5.5% following June’s rate cut, while the 10‑year G‑Sec yield continued its downward trajectory to ~6.3%. Bank credit growth moderated to 9.5% YoY, indicating cautious private lending despite stable systemic liquidity.
Fiscal Position: GST collections in June 2025 were ₹1.85 lakh crore, growing at only 6.2% YoY—the slowest pace in four years. However, Q1 FY 2025–26 collections were 10.7% higher year‑on‑year, supporting fiscal momentum. Capital expenditure remained strong, while the fiscal deficit target improved.
Labour & Employment: Labour Force Participation Rate declined to 54.2%, with Worker Population Ratio at 51.2%. Unemployment remained steady at 5.6%, highlighting marginal seasonal adjustments in rural labour markets rather than structural deterioration.
Sectoral Performance -
Agriculture: Net sown area under kharif crops rose 4% year‑on‑year to 82.96 million hectares, aided by a 7% above‑normal monsoon. MSP increases for several key crops are expected to strengthen farm incomes and reduce import dependence, although uneven rainfall across states poses risks.
Fisheries: Production was projected at 195 lakh tonnes for FY 2024‑25. Marine exports rose 13.3% YoY in June 2025, boosted further by the Comprehensive Economic and Trade Agreement (CETA) with the UK, which is expected to significantly enhance seafood exports.
Coal: Output in June 2025 reached 78.98 million tonnes, with dispatches of 84.09 MT. Captive and commercial mines recorded double-digit growth. Reduced imports for thermal power resulted in foreign exchange savings and strengthened energy self-sufficiency.
Renewable Energy: Installed generation capacity stood at 476 GW by June 2025, with non-fossil sources now exceeding 50% of the total. Solar capacity rose to 116.25 GW, supported by significant quarterly additions and increased adoption of solar pumps under PM-KUSUM.
Steel: Finished steel production for April–June 2025 was 38.6 MT, up 8.6% YoY. Imports fell 27.6% due to safeguard duties and domestic competitiveness, though exports declined by 5.1% amid weak global demand.
IV. Conclusion -
The June 2025 economic and sectoral data reveal a landscape of contrasts. On one hand, inflation has moderated to multi‑year lows, external balances have improved due to resilient services exports, and sectors such as agriculture, renewable energy, and steel production show structural strength. On the other hand, slowing industrial output, subdued GST revenue growth, and weakening labour force participation highlight fragilities in demand and investment momentum.
The macroeconomic environment continues to be shaped by the Reserve Bank of India’s accommodative monetary policy, stabilising financial conditions, and a government focus on capital expenditure. Yet, the uneven performance across sectors indicates that while India is advancing in energy transition, agriculture output, and industrial capacity, persistent weaknesses in urban consumption, merchandise trade, and employment dynamics require close attention.
Overall, the data underscore the balancing act now facing policymakers thereby stimulating demand in an environment of low inflation, while sustaining fiscal and financial stability, and deepening structural shifts such as renewable energy adoption and industrial self‑reliance. The trajectory over the coming quarters will depend on how effectively policy measures can translate near‑term stability into durable, broad‑based growth.