

Welcome to the latest edition of India’s Growth Pulse: September 2025. This monthly tracker offers a detailed and comprehensive view of the country’s economic progress, highlighting key macroeconomic trends, sectoral performance, and policy developments. It underscores the continued robust growth of India’s economy, fueled by strong domestic demand, an investment-driven expansion, and transformative reforms such as GST rationalization. By integrating data on GDP growth, industrial activity, trade, inflation, employment, and sector-specific insights, this tracker delivers a clear and timely snapshot of India’s economic landscape. It serves as a valuable resource for policymakers, analysts, and stakeholders, enabling informed decisions and effective monitoring of India’s growth trajectory.
Key Highlights :
The Indian economy continued its trajectory of robust growth and structural reform throughout August 2025, solidifying its standing as a global economic powerhouse. A combination of strong domestic demand, targeted policy interventions, and a decisive shift toward an investment-led expansion created a highly favorable macroeconomic environment. This period was marked by significant steps toward tax rationalization and sustained momentum in core industries, ensuring that growth was not only rapid but also qualitatively strong and inclusive.
Robust Macroeconomic Growth: Real GDP grew strongly at 7.8% in Q1 FY26 , solidifying India’s position as the world’s fastest-growing major economy. Growth was broad-based, with Gross Value Added (GVA) from the Services sector growing 9.3% and Manufacturing growing 7.7%.
Investment-Led Expansion: The economy is shifting from consumption-led to an investment-led expansion , with Gross Fixed Capital Formation (GFCF, a proxy for investment) recording a strong growth rate of 7.8% in Q1 FY26.
Major GST Reforms (”GST 2.0”): Significant reforms rationalized the tax structure from four slabs to two main rates (5% Merit Rate and 18% Standard Rate), plus a 40% de-merit rate for luxury/sin goods. This reduced the tax burden on everyday items (to 5%), consumer durables (from 28% to 18%), and essential medical supplies, with 36 life-saving drugs now either Nil or 5%.
Social & Consumer Welfare Focus: The GST 2.0 reforms were strategically designed to benefit the common person, resulting in a significantly reduced tax burden on everyday items (now at 5%) and consumer durables (reduced from 28% to 18%). Furthermore, 36 life-saving drugs now attract either a Nil or 5% GST rate, providing critical relief in the health sector.
Fiscal Resilience: Gross GST collections in August 2025 rose 6.5% year-on-year to ₹1.86 lakh crore. A decline in net direct tax collections was attributed to a
significant increase in tax refunds (up 9.81%), indicating an administrative push to clear backlogs rather than an economic slowdown.Industrial Momentum & FDI: The Index of Eight Core Industries (ICI) rebounded sharply, rising 6.3% year-on-year in August 2025 , driven by strong performances in steel, coal, and cement. Foreign Direct Investment (FDI) inflows increased by 14% to $81.04 billion in FY25, with manufacturing FDI rising 18%.
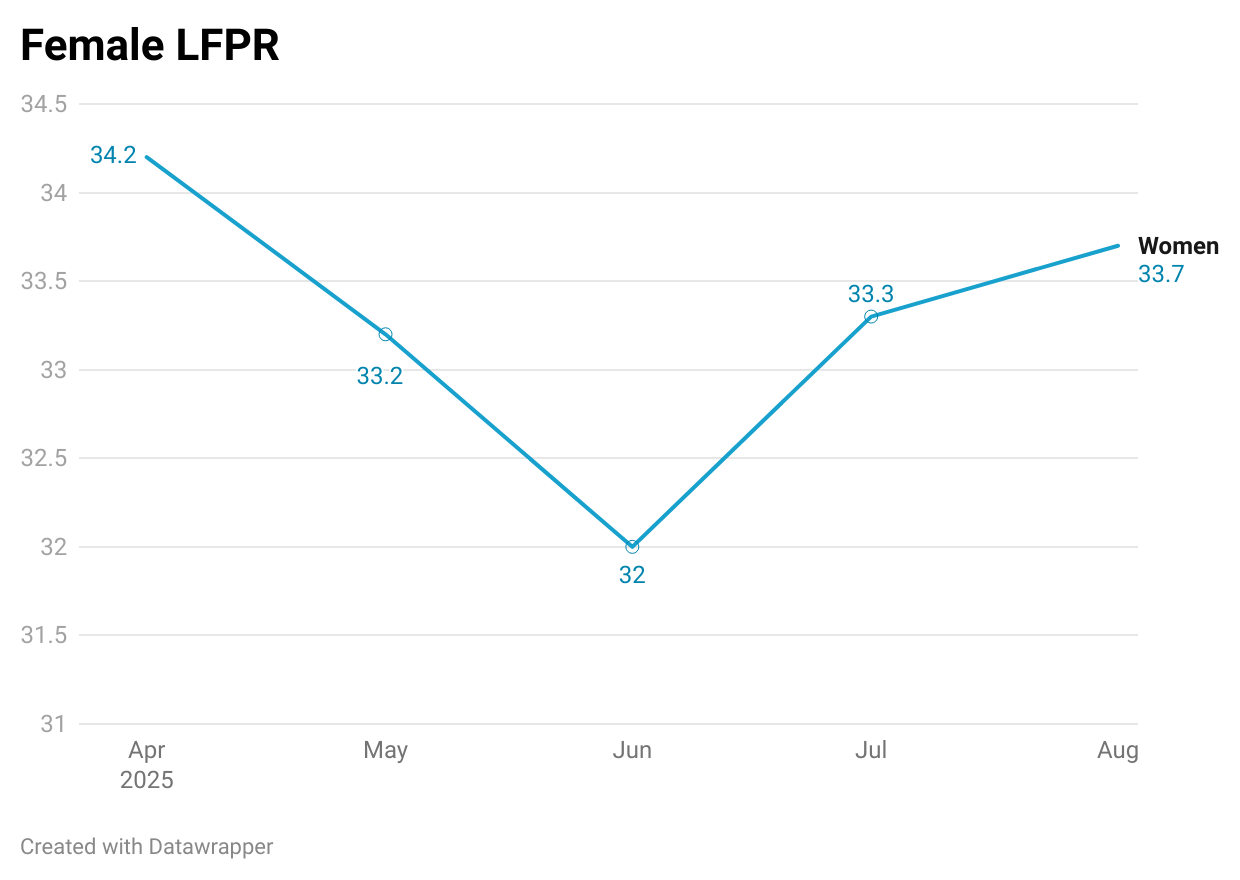
Labor Market Improvement: The overall unemployment rate eased to 5.1% in August. The Female Labor Force Participation Rate (LFPR) showed a sustained rise, reaching 33.7% in August, suggesting a potential structural improvement in women’s workforce engagement.
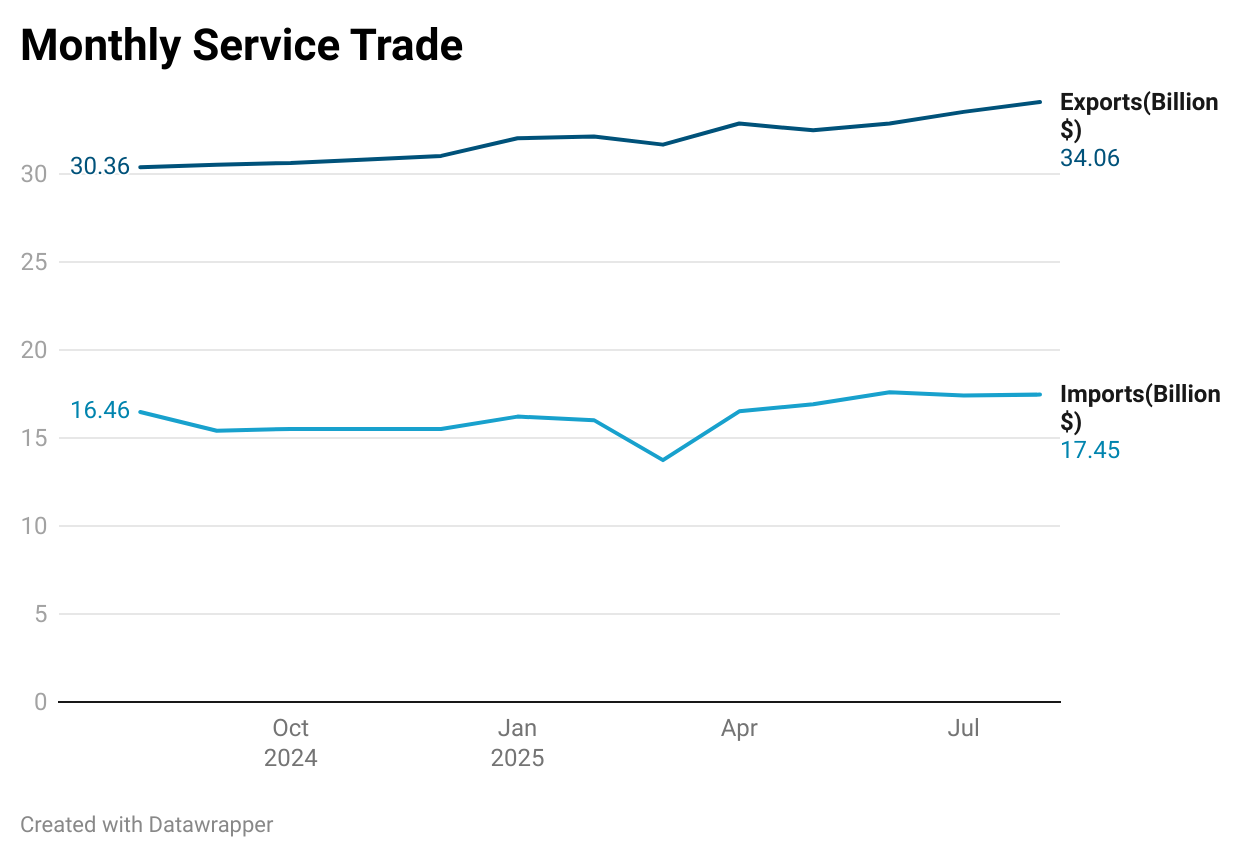
Trade Deficit Contraction: The overall trade deficit (goods + services) was significantly narrowed by 54.53% to $9.88 billion in August 2025, due to total exports growing 9.34% and total imports declining 7%. Services exports, at $34.06 billion, nearly matched merchandise exports and provided a crucial surplus to offset the goods trade gap.
Key Sectoral Boosts: GST rates were sharply reduced on renewable energy devices (from 12% to 5%) and agricultural machinery (to 5%), providing substantial cost savings to promote sustainability and mechanization. In the Coal sector, tax reforms eliminated the inverted duty structure, improving the competitiveness of domestic coal.
Inflation Dynamics: Retail inflation (CPI) inched up to 2.07% in August 2025 but remained comfortably within the central bank’s target. However, Wholesale inflation (WPI) turned positive at 0.52% after two months of deflation, signaling potential future upward pressure on consumer prices.
Strong Foreign Investment and Trade Performance: Foreign Direct Investment (FDI) inflows grew by 14% in FY25 to $81.04 billion, led by an 18% increase in manufacturing FDI, signaling rising global confidence. This, combined with strong Services Exports ($34.06 billion), led to a sharp contraction in the overall trade deficit by 54.53% in August 2025.
The last few weeks have reinforced the narrative of India entering a phase of balanced, sustainable growth characterized by price stability, employment generation, and diversified economic activity. The simultaneous achievement of low retail inflation (2.07%) and robust growth (7.8% in Q1 FY26) creates valuable policy space for continued structural reforms, like the recent GST rationalization, and targeted investments in infrastructure and human capital. For policymakers, these results validate the current economic strategy while highlighting the continued need for careful navigation of monsoon dependencies in agriculture, managing global supply chain disruptions, and maintaining fiscal discipline.
I. The Economic Pulse
This section is dedicated to an overview of macro-fiscal performance. Each major topic is covered as a chapter, allowing for a deep dive into specific economic indicators.
A. Chapter 1 : Tax Collections: A Tale of Two Taxes
Snapshot -
The recent GST reforms significantly alter the landscape for consumers and industries, aiming to simplify the structure and enhance affordability for essential and everyday items while increasing indirect taxation on luxury and sin goods.
The old four-slab GST structure (5%, 12%, 18%, 28%) is replaced with just three main rates 5% for daily use goods, 18% as the standard rate, and 40% for luxury & sin goods making compliance and invoicing easier for businesses and tax authorities.
The reforms correct inverted duty structures in key sectors like textiles and fertilisers, improve export competitiveness, and support farmers, healthcare, and sustainable industries.
GST collections in August 2025 rose 6.5% year-on-year to ₹1.86 lakh crore, marking the eighth straight month above ₹ 1.8 lakh crore; domestic GST revenue grew 9.6% while import-related revenue dipped slightly by 1.2%.
Net direct tax collections fell 3.95% from April–August 2025 due to higher refunds (up 9.81%), not economic slowdown, with gross direct tax collections showing only a minor 1.87% decline.
In Detail -
August 2025 was a landmark month for India’s indirect tax framework, with the GST Council approving a set of “next-generation GST reforms” announced by the Prime Minister on August 15. These changes, often referred to as “GST 2.0,” represent a strategic overhaul of the tax system aimed at simplifying compliance for businesses and reducing the tax burden on citizens, particularly the middle class and the “common man”.
The most significant change is the simplification of the tax structure. The previous four-tiered system (5%, 12%, 18%, and 28%) is being rationalised into a streamlined two-tier framework with a Merit Rate of 5% and a Standard Rate of 18%. A special de-merit rate of 40% has also been introduced for luxury and “sin” goods like premium cars, yachts and tobacco products. This move is expected to increase consumption, especially in the fast-moving consumer goods (FMCG) and automobile sectors, by making many items more affordable.
The tax cuts are broad-based and citizen-centric. GST on common household items has been reduced to 5%. For the aspirational middle class, consumer durables like air conditioners, televisions, and refrigerators, which were previously taxed at 28%, will now fall under the 18% slab. The same reduction from 28% to 18% will apply to small cars and motorcycles with an engine capacity up to 350cc.
Reforms also target key drivers of the economy and social welfare. GST on most drugs and medicines has been reduced from 12% to 5%, with a total of 36 life-saving drugs now either exempt or taxed at Nil.
Agricultural machinery and equipment, renewable energy devices, and handicrafts are also seeing their GST rates reduced from 12% to 5%, which is expected to support farmers, promote sustainable energy, and boost labor-intensive industries. These changes are also intended to correct a long-standing “inverted duty structure” in sectors like textiles and fertilisers, thereby improving their competitiveness and export potential.
While these tax reductions are designed to stimulate demand, the GST collections for the month of August showed continued fiscal strength. Gross GST collections reached ₹ 1.86 lakh crore, a 6.5% increase year-on-year, though this was slightly lower than July’s collection of ₹ 1.96 lakh crore. This performance indicates a resilient tax base that can absorb these strategic rate cuts without a significant fiscal shock.
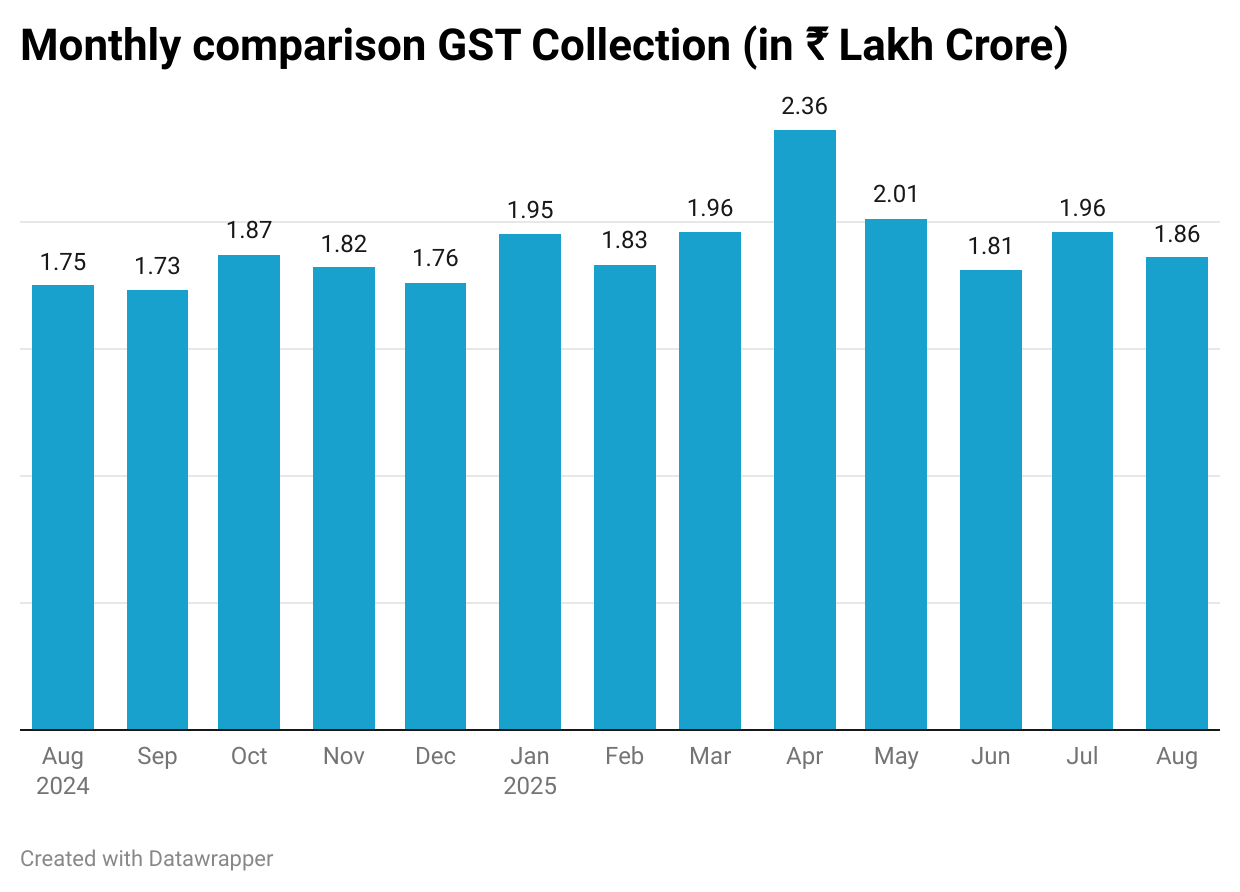
GST collections rose by 6.5% year-on-year to ₹1.86 lakh crore in August 2025. This marks the eighth consecutive month that revenues have remained above the ₹ 1.8 lakh crore mark, reflecting robust domestic consumption and steady economic activity. The gross domestic GST revenue saw a particularly strong growth of 9.6% to ₹ 1.37 lakh crore, while the tax from imports slipped by a marginal 1.2%.
In contrast, net direct tax collections showed a decline, but a closer look at the data reveals a different narrative. From April 1 to August 11, net direct tax collections fell by 3.95% year-on-year to ₹ 6.64 trillion. However, this decline was not due to a lack of economic activity. It was primarily a result of a significant increase in tax refunds, which rose by 9.81% to ₹ 1.35 lakh crore during the same period. Gross direct tax collections, before accounting for these refunds, only saw a minor decrease of 1.87%.
The diverging trends between GST and Direct Tax collections highlight a critical nuance in the tax and administrative landscape. The resilient GST numbers provide a strong signal of robust consumption, which is a key measure of economic activity. The decline in net direct tax collections, on the other hand, appears to be an administrative consequence of an effort to clear tax refund backlogs, rather than an indicator of a fundamental weakness in corporate profitability or personal income.
B. Chapter 2 : Macroeconomic Performance: The Underpinnings of Growth
Snapshot -
India’s Real GDP grew 7.8% in Q1 FY26, up from 6.5% last year, while GVA rose 7.6%, reaffirming India as the world’s fastest-growing major economy.
Broad-based sectoral growth: Services grew 9.3%, manufacturing 7.7%, construction 7.6%, and agriculture 3.7%, reflecting balanced expansion across all major sectors.
Strong growth in both services and secondary sectors (manufacturing, construction) indicates stable, durable, and less fragile economic momentum.
On the demand side, private consumption grew 7.0% (slower than last year), but this was offset by higher investment (7.8%) and government spending (9.7%).
The economy is shifting toward an investment-led expansion, as government capital expenditure boosts productive capacity and encourages private sector investment.
In Detail -
GDP and GVA: The Primary Growth Engines
The Indian economy’s performance in the first quarter of the fiscal year 2025-26 was a testament to its broad-based strength. According to the National Statistics Office (NSO) under MoSPI, Real GDP is estimated to have grown by 7.8%, a substantial acceleration from the 6.5% growth recorded in the same period of the previous fiscal year. The Gross Value Added (GVA) also registered a strong growth of 7.6% at constant prices. This upward trajectory solidifies India’s position as the world’s fastest-growing major economy.
The sectoral breakdown of GVA demonstrates a synchronised expansion across the board, which is a key indicator of economic health. The Tertiary Sector, which includes services, was the main driver, recording a robust growth of 9.3% at constant prices. This represents a significant improvement over the 6.8% growth in Q1 of the previous year. The Secondary Sectors also contributed meaningfully, with both the manufacturing and construction sectors posting impressive gains of 7.7% and 7.6%, respectively. Both figures surpassed the 7.5% growth mark, indicating renewed vigor in industrial and infrastructure-related activities. Even the Agriculture and Allied Sector, which includes livestock and fishing, recorded a notable acceleration to 3.7%, up from 1.5% in the prior corresponding period.
The confluence of strong performance across the services, manufacturing, and construction sectors is a crucial development. A recovery driven solely by services is often viewed as fragile, but when paired with robust growth in the secondary sector, it suggests that investment and production are translating into tangible economic output. This synergy creates a more stable and durable growth path, less vulnerable to external shocks. The acceleration in the agriculture sector also contributes to a comprehensive and inclusive growth narrative, supporting a wider demographic base.
Demand-Side Drivers: Consumption, Investment, and Government Spending
An in-depth analysis of the demand-side components of the economy reveals a strategic shift in the drivers of growth. While Real Private Final Consumption Expenditure (PFCE) grew by 7.0% in Q1 FY26, a moderation from the 8.3% growth in the corresponding period last year, this was more than compensated for by a significant uptick in investment and government spending.
Gross Fixed Capital Formation (GFCF), a key proxy for investment, recorded a strong growth rate of 7.8% at constant prices, improving from 6.7% in Q1 FY24. Simultaneously, Government Final Consumption Expenditure (GFCE) rebounded sharply with a 9.7% growth rate in nominal terms, a substantial increase over the 4.0% in Q1 FY24.
The decline in the growth rate of private consumption, while not a cause for alarm given its robust level, is a nuanced development. However, the simultaneous acceleration in both private and public investment points to a desirable shift in the composition of demand. This indicates that government-led capital expenditure is effectively laying the groundwork for future productive capacity and is likely crowding in private sector investment. It suggests that the economy is transitioning from a consumption-led recovery to an investment-led expansion.
C. Chapter 3 : Growth and Output
Snapshot -
India’s core sector rebounded strongly in August 2025, with the Index of Eight Core Industries (ICI) rising 6.3% year-on-year, the fastest pace in over a year, driven mainly by steel, coal, and cement.
The April–August 2025 cumulative growth stood at 2.8%, below last year’s 4.6%, indicating uneven momentum despite August’s sharp rebound.
The manufacturing sector gained pace, with the Index of Industrial Production (IIP) up 3.5% in July, led by basic metals, electrical equipment, and non-metallic mineral products.
India’s Manufacturing PMI surged to 59.8 in August, the highest in over 17 years, signaling strong future growth momentum, even as IIP reflects only moderate output growth for now.
Foreign Direct Investment (FDI) inflows hit $ 81.04 billion in FY25, up 14%, with manufacturing FDI rising 18% to $ 19.04 billion, boosted by government initiatives like the PLI scheme.
In Detail -
India’s core sector posted a strong rebound in August 2025, as the combined Index of Eight Core Industries (ICI) rose by 6.3% year-on-year, marking its fastest pace in over a year. This performance was especially notable compared to August 2024, when the sector had contracted by 1.5%. The positive momentum was supported mainly by robust growth in steel, coal, and cement, indicating renewed momentum in infrastructure and industrial activity, despite a still-cautious outlook for crude oil and gas output.
The ICI not only reversed the previous year’s slump but also provided a much-needed boost to the broader industrial landscape. The core sector’s April-August cumulative growth, however, stood at 2.8%, which was notably below the 4.6% seen in the same period last year, suggesting ongoing weakness in some areas. This rebound in August was driven by a favorable base effect and a marked pickup in a few key sectors.
The momentum in steel, coal, and cement is a positive lead indicator for construction, infrastructure, and broader manufacturing activity. Looking ahead, continued retreat of the monsoon is expected to support further growth in cement and fertiliser, while pending investments and policy support could enable further improvements in the remaining sub-sectors. Nonetheless, the sluggish performance in crude oil and gas points to the need for deeper reforms and technology adoption in India’s energy sector to sustain broader industrial growth.
The manufacturing sector continues to gain momentum, providing a critical boost to the overall economy. The Index of Industrial Production (IIP), which measures the volume of output, recorded a growth of 3.5% year-on-year in July 2025, a significant jump from 1.5% in June. This growth was primarily driven by a 5.4% year-on-year expansion in the manufacturing sector. The top three contributors to this growth were the manufacture of basic metals, electrical equipment, and other non-metallic mineral products.
Reinforcing this positive outlook, the HSBC India Manufacturing Purchasing Managers’ Index (PMI) surged to 59.8 in August, up from 59.3 in July. A PMI reading above 50 signifies expansion, and this reading indicates the fastest improvement in factory operating conditions in over 17 years.
There is a notable gap between the official IIP data and the privately compiled PMI. While IIP figures, which are backward-looking and track output volumes, show moderate growth, the PMI, which is a forward-looking indicator based on new orders and sentiment, suggests a much stronger underlying momentum. This could indicate a time lag, where rising new orders (PMI) have not yet fully translated into a corresponding increase in output (IIP) due to capacity expansion or supply chain lead times. The strong PMI signals that the IIP figures in the coming months are likely to see an acceleration, reinforcing the positive trajectory of the manufacturing sector.
The investment landscape for August 2025 reflects a robust vote of confidence from global investors in India’s long-term growth story. In FY25, India clocked gross Foreign Direct Investment (FDI) inflows of $ 81.04 billion, representing a 14% year-on-year increase.
A particularly significant development is the accelerated pace of FDI into the manufacturing sector, which surged by 18% to $ 19.04 billion in FY25. This is a direct consequence of strategic government initiatives like the Production Linked Incentive (PLI) scheme, which is designed to attract capital and technology into key sectors. The increase in manufacturing FDI is not a random fluctuation; it is a direct result of targeted policies aimed at making India a global manufacturing hub. This inflow of capital validates the government’s long-term vision and provides a forward-looking signal for future job creation, technology adoption, and industrial output.
D. Chapter 4 : Price Dynamics and Inflationary Environment
Snapshot -
Retail inflation (CPI) rose slightly to 2.07% in August 2025, up from 1.61% in July, but stayed well within the central bank’s 2-6% target range, mainly due to higher food prices.
Wholesale inflation (WPI) turned positive at 0.52% in August after two months of deflation, driven by food products, manufactured goods, and non-food articles.
The WPI Food Index moved into positive territory at 0.21% (from -2.15% in July), though the Fuel and Power segment continued in deflation at -3.17%.
Policy measures like GST 2.0 reforms and a simplified tax structure, along with good monsoon forecasts, prompted the RBI to lower its FY26 CPI projection to 3.1% from 3.7%.
Narrowing divergence between WPI and CPI signals possible upward pressure on consumer prices ahead, with risks from skewed rainfall affecting Kharif crops and rising input costs feeding into retail inflation.
In Detail -
The inflation narrative in August 2025 was marked by a slight uptick in both retail and wholesale prices, though overall price stability was maintained. The Consumer Price Index (CPI), inched up to 2.07% in August, an increase from 1.61% in July. Despite this rise, CPI remained comfortably within the central bank’s 2-6% target band. The primary contributors to this modest increase were higher prices for vegetables, meat, fish, and eggs.
A more significant shift was observed in the Wholesale Price Index (WPI), which moved back into positive territory for the first time in two months, recording an annual inflation rate of 0.52% for August. This reversal from a deflationary trend was largely driven by an increase in the prices of food products, manufactured goods, and non-food articles.
The WPI Food Index, saw its inflation rate turn positive to 0.21% in August from a deflationary -2.15% in July. While this change suggests some upward price pressures at the wholesale level, the Fuel and Power segment continued to experience deflation at -3.17%. The narrowing divergence between the WPI and CPI could be an early indicator of a potential pass-through of producer-level price increases to the retail level in the coming months.
Effects of the recently announced “GST 2.0 reforms package” and a planned simplified two-tier tax structure are expected to moderate future inflation by reducing production costs. This policy-driven expectation, combined with a projected good monsoon and strong kharif sowing, has led to a downward revision of inflation forecasts for the fiscal year. For instance, the RBI has lowered its FY26 CPI forecast to 3.1% from 3.7%, and other institutions have followed suit.
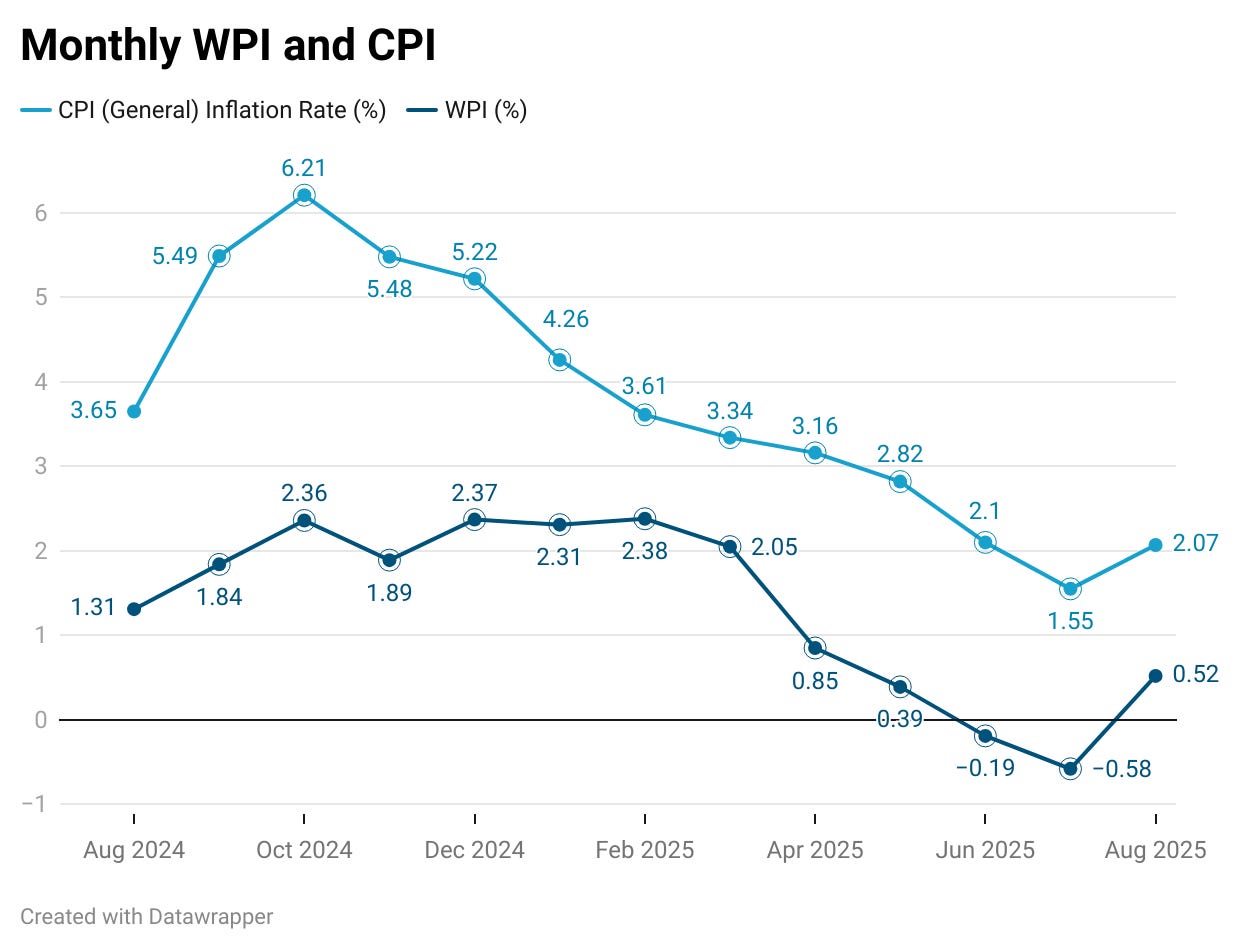
The divergence between the WPI and CPI is a critical element for analysis. As WPI is often a leading indicator for CPI, the fact that wholesale prices are now in positive territory, driven by rising input costs, could signal that consumer prices will face upward pressure in the coming months. “Spatially skewed rainfall” posing a risk to Kharif crops is a potential factor that could contribute to this trend. The firming of producer prices, while not yet fully reflected in consumer-facing inflation, indicates that the complex interplay of rising raw material costs and robust demand is creating a new price equilibrium.
E. Chapter 5 : Labor and Employment: Rising Female Workforce Participation
Snapshot -
Female Labor Force Participation Rate (LFPR) increased from 32% in June to 33.7%
Overall rural unemployment has declined successively for three months in a row, falling from 5.1% in May to 4.3% in August
Male unemployment reached a five-month low at 5.0%, with improvements in both urban and rural areas.
Rural unemployment steadily declined for three months, dropping from 5.1% in May to 4.3% in August, supported by strong agricultural growth.
The overall Worker Population Ratio (WPR) improved to 52.2% in August, up from 51.2% in June, reflecting stronger labor market engagement.
Female workforce participation surged, with WPR rising to 32.0% and LFPR to 33.7%, signaling a possible structural shift toward greater female participation in the labor force.
In Detail -
The labor market showed significant positive momentum in August 2025, with the unemployment rate declining for the second consecutive month. According to the PLFS, the overall unemployment rate for persons aged 15 years and above eased to 5.1% in August, down from 5.2% in July and 5.6% in June. This improvement was broad-based and not confined to a single demographic.
The unemployment rate for males hit a five-month low of 5.0% in August, with gains visible in both urban and rural areas. Overall rural unemployment has declined successively for three months in a row, falling from 5.1% in May to 4.3% in August. This aligns with the robust agricultural growth reported in Q1, suggesting a strong recovery in the rural economy.
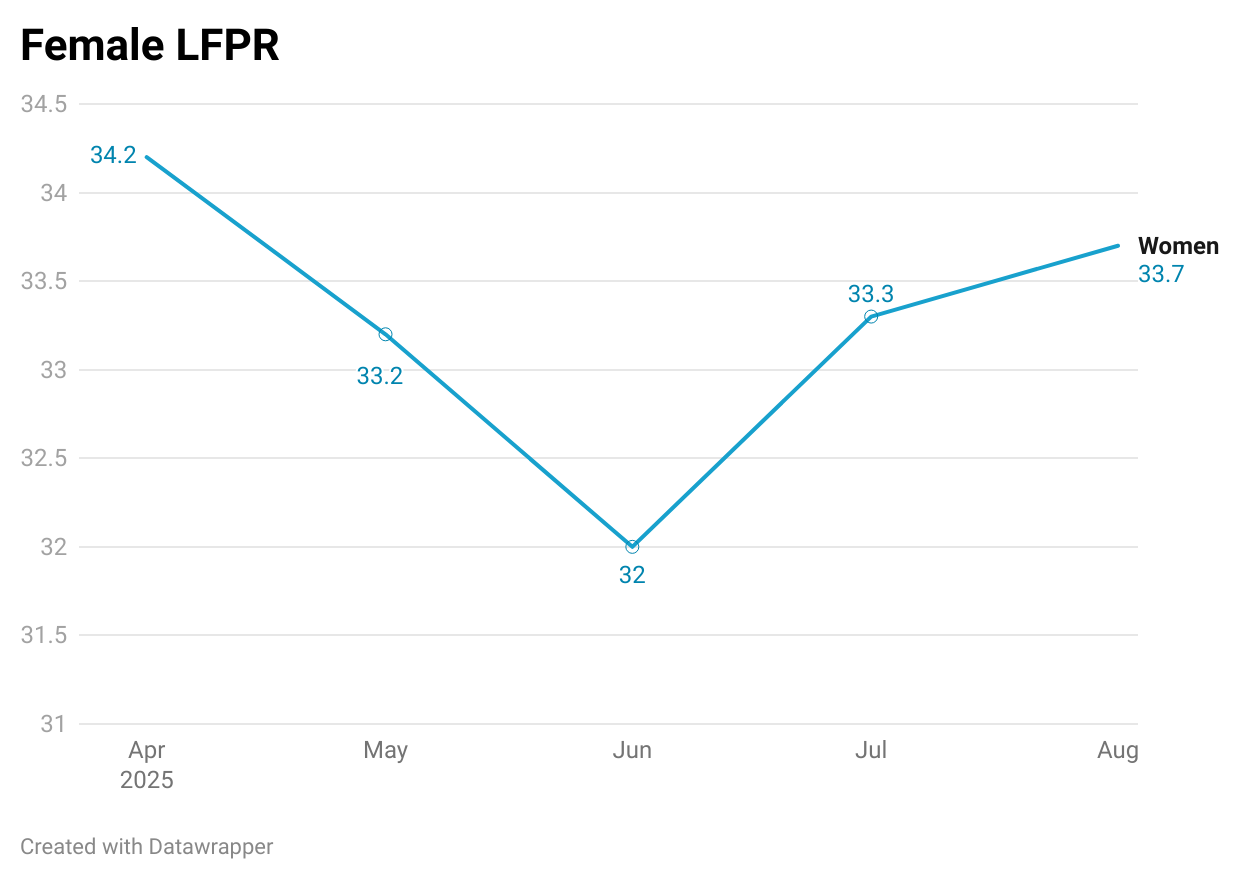
Beyond the unemployment rate, other key labor market indicators also showed encouraging trends. The overall Worker Population Ratio (WPR) improved to 52.2% in August, compared to 51.2% in June. The most notable progress was observed in female workforce participation. The Worker Population Ratio (WPR) among women rose for two consecutive months to 32.0% in August from 30.2% in June.
Similarly, the female Labor Force Participation Rate (LFPR) increased from 32% in June to 33.7% in August, with gains in both rural and urban areas. The sustained and successive increase in these female workforce metrics indicates a potential structural shift in the labor market. This expansion of the labor pool holds significant long-term implications for India’s economic growth, as it can boost household incomes, increase consumption, and contribute to a more inclusive and productive economy.
F. Chapter 6 : Trade and External Sector
Snapshot -
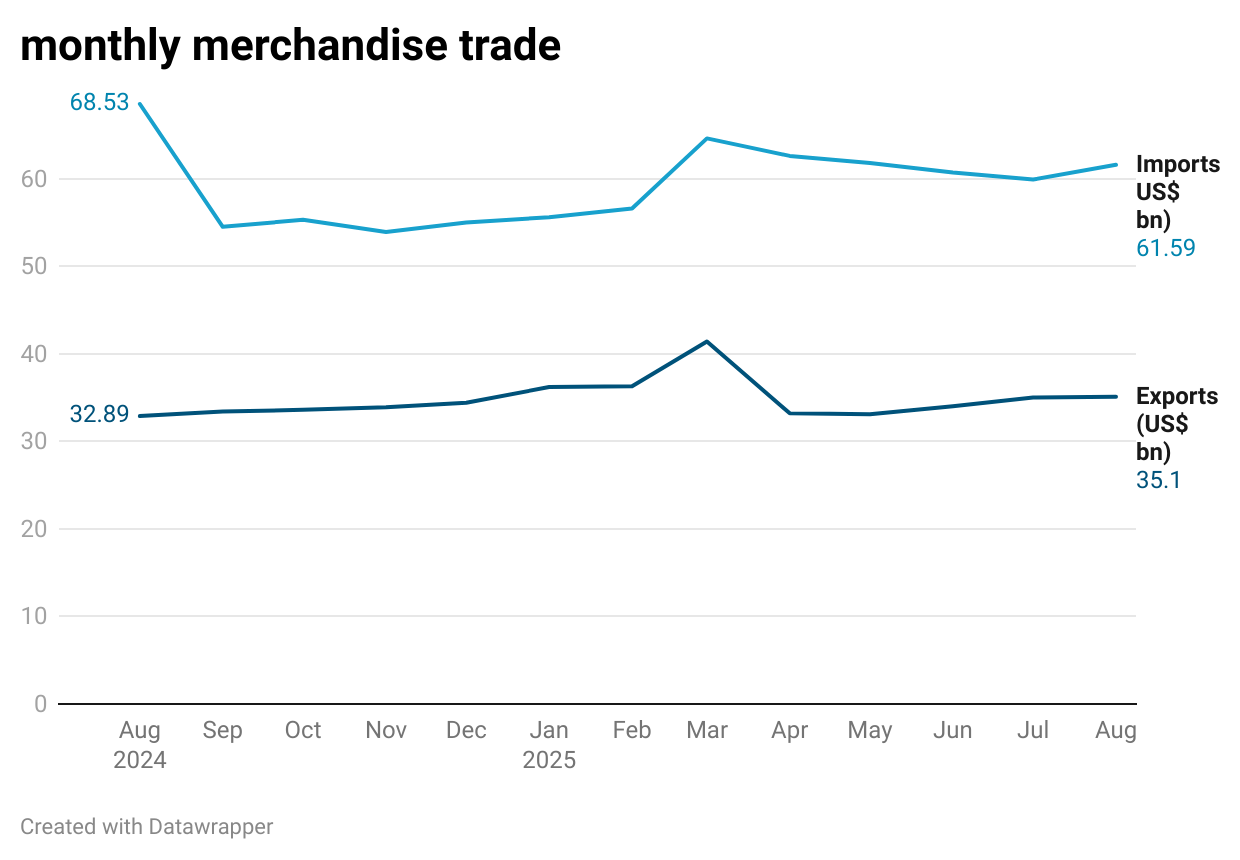
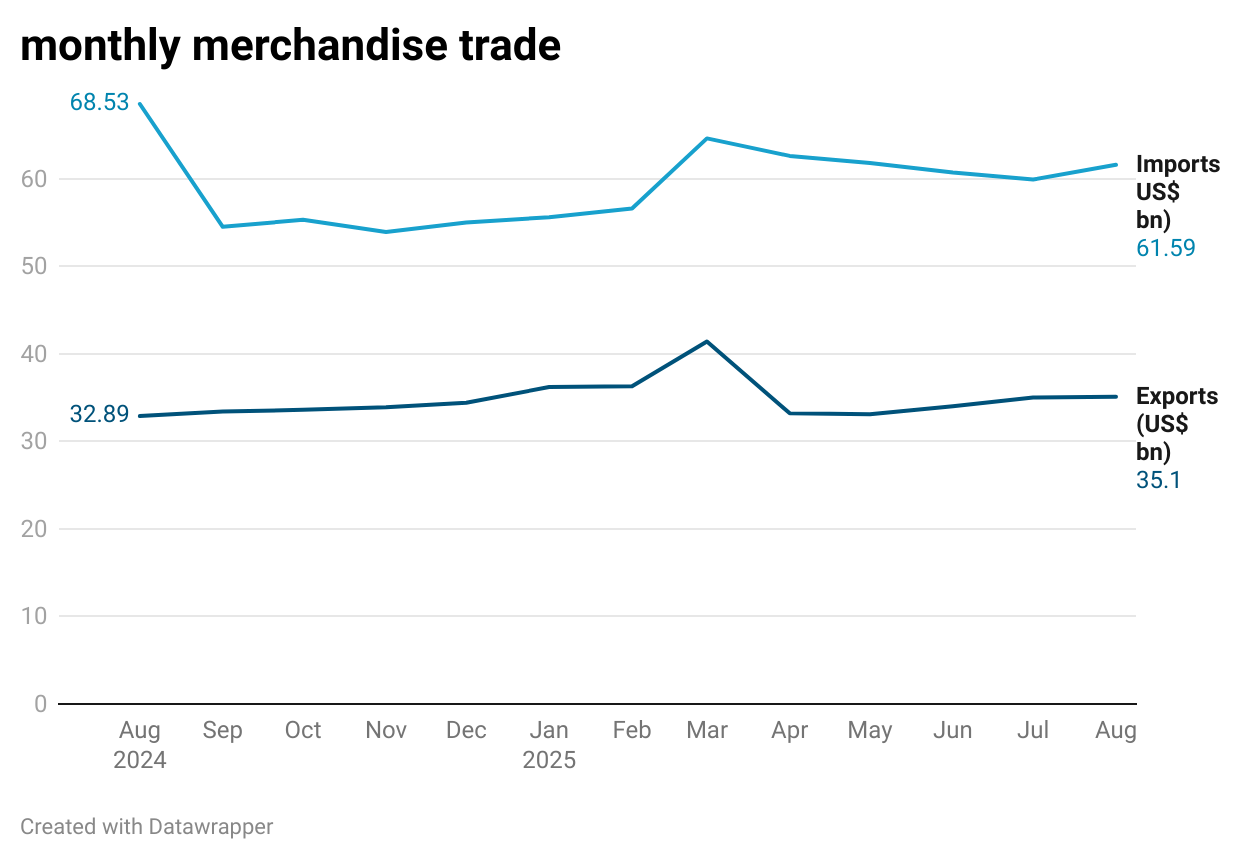
India’s merchandise exports in August 2025 rose 6.7% year-on-year to $35.1 billion, while imports fell 10.1% to $61.59 billion, narrowing the merchandise trade deficit to $26.49 billion.
Overall exports (goods + services) grew 9.34% to $69.16 billion, while total imports declined 7% to $79.04 billion, cutting the overall trade deficit to $9.88 billion from $21.73 billion a year earlier.
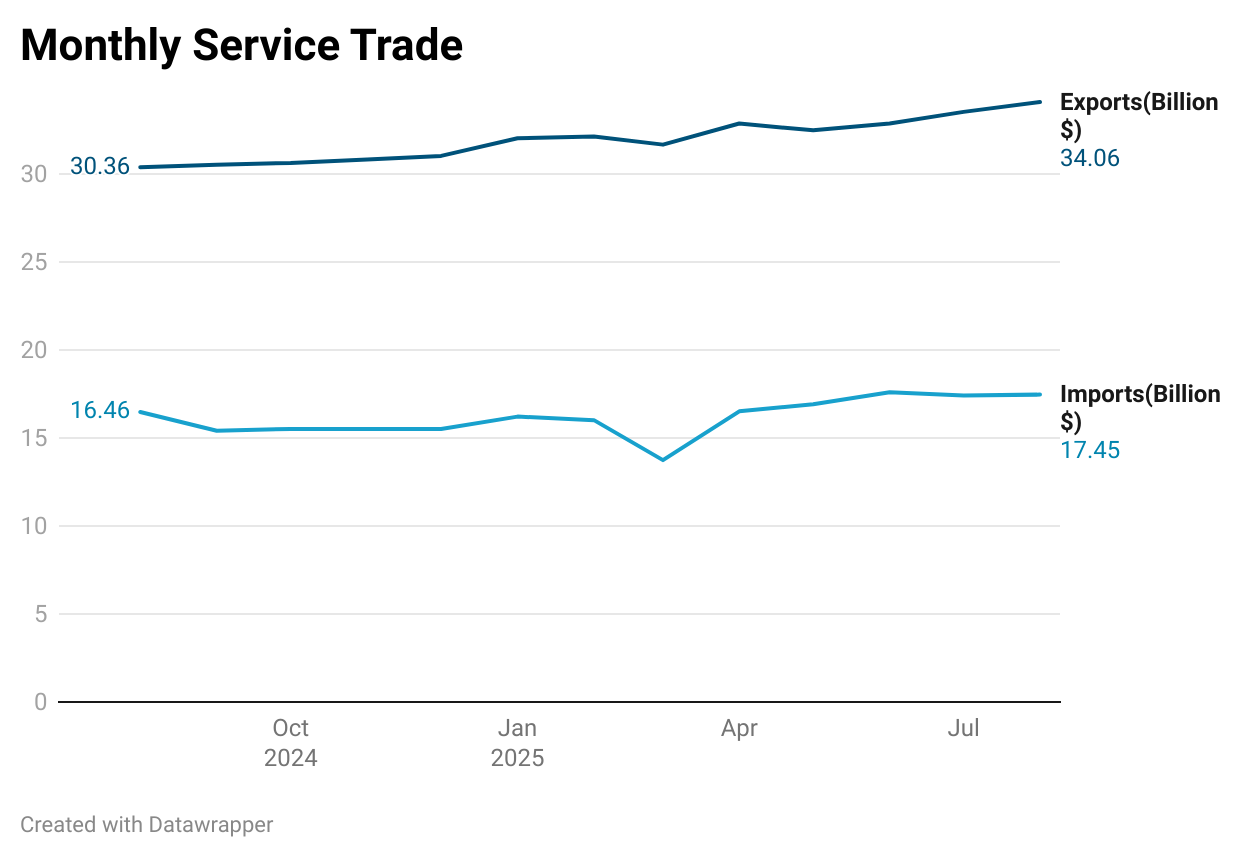
The services sector nearly matched merchandise exports with $34.06 billion in August 2025, generating a cumulative trade surplus of $80.97 billion in April–August, helping offset the merchandise trade gap.
Export growth was driven by Electronic Goods (+25.93%), Gems & Jewellery (+15.57%), Petroleum Products (+6.54%), and Engineering Goods (+4.91%).
Import declines were sharp in categories like Project Goods (-90.63%), Pulses (-64.14%), Gold (-56.67%), and Coal & related (-26.2%), reflecting the impact of policies promoting domestic self-reliance.
In Detail -
India’s merchandise exports in August 2025 grew by 6.7% year-on-year, reaching $35.1 billion (August 2024: $32.89 billion), while imports dropped 10.1% to $ 61.59 billion (August 2024: $68.53 billion), resulting in a narrowed merchandise trade deficit of $ 26.49 billion (August 2024: $35.64 billion).
Total exports, which combine merchandise and services, were estimated at US$ 69.16 billion, registering a strong positive growth of 9.34% compared to August 2024. Concurrently, total imports declined by 7% to US$ 79.04 billion. This divergence led to a dramatic narrowing of the overall trade deficit, which shrank to US$ 9.88 billion in August 2025, a substantial improvement from the US$ 21.73 billion deficit recorded in the same month of the previous year.
A breakdown of the trade figures reveals the crucial role of the services sector. While merchandise exports showed solid growth, rising to US$ 35.10 billion, services exports at an estimated US$ 34.06 billion nearly matched this figure. The services sector is proving to be a robust engine of export growth, with its trade surplus for the April-August period reaching US$ 80.97 billion. This positive contribution serves as a vital counterbalance to the persistent merchandise trade deficit, which stood at US$ 122.39 billion for the same period.
The shift in the trade balance is also a consequence of a changing composition of both exports and imports. Key drivers of merchandise export growth in August 2025 included Electronic Goods, which saw a remarkable increase of 25.93%, followed by Engineering Goods (+4.91%), Gems & Jewellery (+15.57%), and Petroleum Products (+6.54%). On the import side, the significant decline was largely due to a sharp drop in key categories such as Project Goods (-90.63%), Pulses (-64.14%), Gold (-56.67%), and Coal, Coke & Briquettes, etc. (-26.2%).
The sharp decline in imports of items like pulses and coal directly reflects the success of domestic policy initiatives aimed at reducing import dependency. This suggests that the government’s push for self-reliance is not just a strategic slogan but is visibly impacting India’s trade fundamentals and contributing to a more sustainable trade balance.
II. Sectoral Performance
This second part would analyse the performance of key sectors within the economy. Each sector would be a dedicated chapter, providing a focused view of its health and trends.
G. Chapter 7 : Agriculture & Allied Sector
Snapshot -
Robust Kharif Sowing: By August 15, 2025, kharif crops were sown on 1039.81 lakh hectares, up 37.39 lakh hectares year-on-year, led by a sharp increase in rice and maize acreage, though oilseeds and cotton acreage declined.
Strong Water Availability: Rainfall was 1% above normal, and live water storage in 161 reservoirs stood at 72.5% of capacity, 133% higher than the 10-year average ensuring sufficient water for both Kharif and Rabi crops.
Lower Farm Equipment Costs: GST on tractors, harvesters, rotavators, and other implements was cut to 5%, giving farmers direct savings of ₹ 25,000–₹ 1,87,000 per unit and boosting adoption of mechanisation.
Cheaper Inputs for Sustainable Farming: Steep GST cuts on biological pesticides, micronutrients, solar pumps, and drip irrigation systems make organic, natural, and resource-efficient farming more affordable.
Boost for Rural Economy: Exemptions and lower GST on dairy products, processed foods, cement, and iron benefit rural households, SHGs, and infrastructure projects, enhancing income, development, and women’s empowerment in villages.
In Detail -
Kharif Sowing Progress: As of August 15, 2025, kharif sowing reached 1039.81 lakh hectares, up by 37.39 lakh hectares compared to 1002.41 lakh hectares sown by the same date last year. Notably, rice led the increase with 398.59 lakh hectares sown, 35.67 lakh hectares higher year-on-year. However, oilseeds (particularly soybean, groundnut, and sesamum) and cotton lagged, showing acreage declines relative to last year.
As of August 10, the All-India cumulative rainfall was 1% higher than its Long Period Average (LPA), although regional variations were noted. More importantly, the live water storage in 161 major reservoirs was at 132.40 billion cubic meters (BCM), representing 72.5% of the total live storage capacity. This level is a robust 133.1% of the average storage over the last ten years, which is a strong indicator of adequate water resources not only for the ongoing Kharif season but also for the upcoming Rabi crops.
The total area covered under coarse cereals nationally was 192.91 lakh hectares (lh) against 179.62 lh a year ago, marking an increase of 12.17 lh. Maize, in particular, has emerged as a significant gainer this season, with its coverage reaching 94.84 lh, an increase of 10.54 lh over the 84.30 lh reported in the previous year.
Major Cost Savings on Farm Equipment: The GST rate on agricultural machinery including tractors, harvesters, rotavators, power tillers, and various planting and harvesting implements—has been reduced from 12–18% to 5%, resulting in direct savings ranging from ₹ 25,000 to ₹ 1,87,000 per unit for farmers depending on equipment type and capacity. This sharp reduction lowers capital costs, aids especially small and marginal farmers, and enables wider adoption of mechanisation in Indian agriculture.
Cheaper Inputs for Sustainable and Allied Farming: GST on biological pesticides, micronutrients, and key raw materials for fertilisers has also been cut steeply, driving adoption of organic and natural farming methods. Additionally, equipment for energy-efficiency (solar pumps, research tools) and irrigation (drip systems) is now more affordable, encouraging resource-efficient practices and the shift to sustainable agriculture across the country.
Boost for Dairy, Food Processing & Rural Women: The complete exemption of GST on milk and cheese, as well as lower rates for ghee, butter, and processed foods, directly increases disposable income for dairy farmers, cattle rearers, and rural self-help groups (especially Lakhpati Didis). Similarly, processing units, cold chains, preserved farm outputs (like dry fruits, prepared fish, honey), and rural handicraft production benefit from lower taxes, promoting value addition and broad-based income growth in villages.
Affordable Rural Infrastructure and Inclusive Growth: Lower GST on cement and iron brings down the cost of building homes under PM Awas Yojana and infrastructure like schools, Anganwadis, and Panchayat Bhawans. These changes benefit poor and rural populations, ensuring more affordable development. By increasing demand and income in the countryside, the reforms drive inclusive growth while strengthening women’s financial empowerment and supporting allied sectors such as animal husbandry, beekeeping, and fisheries.
H. Chapter 8 : Coal
Snapshot -
Coal production from captive and commercial mines reached 14.43 MT in August 2025, with dispatches at 15.07 MT, showing strong year-on-year growth of 11.88% and 9.12%.
Operational efficiency, faster clearances, and supportive policy measures enabled better capacity utilization and consistent coal supply.
The 56th GST Council Meeting restructured taxation by removing the GST Compensation cess and increasing the basic GST rate on coal from 5% to 18%, rationalising the effective tax incidence to about 39.81%.
Taxation reforms eliminated the inverted duty structure, unlocking unclaimed GST credits for coal companies, improving liquidity, accounting efficiency, and competitiveness of domestic coal over imports.
The reforms reduced costs significantly: coal grades G6 to G17 saw a cut of ₹ 13.40–₹ 329.61 per tonne, while the power sector benefits with savings of ~₹260 per tonne, lowering electricity generation costs by 17–18 paise/kWh.
In Detail -
The coal sector in August 2025 demonstrated robust performance driven by both policy reform and operational advancements. Monthly coal production from captive and commercial mines reached 14.43 million tonnes (MT), while dispatches climbed to 15.07 MT, marking year-on-year increases of 11.88% and 9.12% respectively compared to the same period the previous year. This strong growth is attributed to enhanced operational efficiency, strategic policy measures, and faster approvals, which have together enabled coal companies to better utilise their mining capacity and maintain consistent production and supply.
Significant taxation reform was introduced in the 56th GST Council Meeting, which removed the flat GST Compensation cess and raised the basic GST rate on coal from 5% to 18%. These changes resulted in a lower overall tax incidence for most grades of coal and greater uniformity in taxation. Most notably, the tax incidence across coal grades has been rationalised to around 39.81%. The reforms also eliminated the inverted duty structure, allowing coal companies to utilise previously unclaimed GST credits, thereby enhancing financial liquidity and improving accounting efficiency for the sector.
With the removal of the GST compensation cess, Indian coal has become more competitive against imported coal, especially in the context of the Government’s Aatmanirbhar Bharat initiative. Earlier, high-quality imported coal had a cost advantage due to the cess, but post-reform, domestic low-grade coal now enjoys a level playing field. This has positioned India’s coal sector for import substitution, with anticipated reduction in unnecessary coal imports. The resulting cost advantage supports domestic industries, particularly power generation, steel, and cement, and contributes to balancing the national trade deficit.
These reforms have led to an overall reduction in the tax burden on coal, with decreases for coal grades G6 to G17 ranging from ₹13.40 per tonne to ₹329.61 per tonne. For the power sector, this change means a cost reduction of approximately ₹260 per tonne, which translates to a saving of 17–18 paise per kWh in power generation costs.
I. Chapter 9 : Energy & Power
Snapshot -
Electricity generation growth: All-India electricity generation in August 2025 rose by 3.1% year-on-year, totaling 133,713.01 GWH.
Policy boost for renewables: The GST reduction from 12% to 5% on renewable energy is expected to save up to ₹ 1.5 lakh crore in investments and lower project costs by 2-3%.
Installed capacity milestone: As of August 31, 2025, India’s total installed renewable energy (RE) capacity, including large hydro, stood at 242.63 GW; with nuclear (8.78 GW), the total non-fossil capacity reached 251.41 GW.
Energy mix dynamics: In August, thermal generation dominated with 78.18% of supply, while hydro contributed a strong 17.59% due to healthy reservoir levels, supporting grid stability during high demand.
Record RE addition: A record 5.13 GW of RE capacity was added in August 2025, led by 4.11 GW of solar, with hydro providing crucial flexibility to balance renewable variability and ensure grid stability.
In Detail -
Overall All-India electricity generation registered a moderate YoY increase of 3.1% in August 2025. The actual total generation for the month reached 133,713.01 GWH.
The Ministry of New and Renewable Energy (MNRE) projects that this policy change, which reduces GST from 12% to 5%, could save up to ₹1.5 lakh crore in investments and lower project costs by 2-3%.
Cumulatively, as of August 31, 2025, India’s total installed RE capacity (including Large Hydro) stood at 242,625.77 MW (approximately 242.63 GW). When factoring in Nuclear Power (8,780.00 MW) 1 , the total non-fossil capacity reached 251,405.77 MW. This rapid deployment supports the Central Electricity Authority’s (CEA) strategic projection of achieving a 62% non-fossil capacity mix out of an estimated 777 GW total capacity by 2029-30.
An analysis of the energy mix reveals the importance of non-thermal sources in supporting grid stability during a period of rising industrial demand. While Thermal sources provided the majority of the supply, generating 104,541.85 GWH (78.18% share), Hydro generation provided a critical contribution of 23,515.94 GWH (17.59% share). This high hydro output directly reflects the robust CWC reservoir levels, demonstrating the complementary role of high water inventory in stabilising power supply.
The operational environment in August demonstrates a crucial complementarity between Hydro and Thermal generation. The high water storage ensured that 23.5 GW of hydro capacity could generate consistent power. This provided essential, flexible peaking capacity, critical for effectively absorbing the variability introduced by the record 5.1 GW monthly RE addition. This synergy stabilises the national grid, reducing the reliance on inflexible thermal units for balancing supply and demand during the rapid transition period.
J. Chapter 10 : Manufacturing and Industrial Output
Snapshot -
The steel sector led core industries in August 2025 with output surging 14.2% YoY, driven by capital goods and infrastructure construction.
Crude steel production rose 11% to 13.8 MT, while finished steel output grew 7% to 13.35 MT.
Domestic steel consumption increased 9% to 13.69 MT, showing that production growth is being directly absorbed by infrastructure and construction demand.
Cement production grew 6.1% YoY in August 2025 and posted 8.4% growth in April–August FY26, reflecting sustained construction momentum.
Softer input costs and strong demand support margin stability and capacity expansion, with the sector adding 130 MT by FY27 and expected 6–7% volume growth in FY26.
In Detail -
Steel Sector: Indicators of Accelerated Demand
The Steel sector was the leading performer among the core industries in August 2025. Steel output surged by an impressive 14.2% Y-o-Y, confirming strong momentum across capital goods and infrastructure construction.
The production figures reflect this strength: Crude steel output reached 13.8 Million Tonnes (MT) in August, growing 11% YoY, while finished steel production rose 7% to 13.35 MT. Crucially, domestic consumption of steel kept pace, increasing by 9% to an estimated 13.69 MT during the month. This high domestic absorption rate confirms that the increased production is immediately flowing into ongoing public infrastructure projects and construction, indicating strong, immediate demand rather than merely inventory build-up.
Cement Sector: Construction Momentum and Margin Stability
Cement output growth reaffirms the sustained positive trend in both the housing and large-scale infrastructure construction segments. Cement production expanded by 6.1% YoY in August 2025. Over the fiscal year, the cumulative growth for April–August FY26 was strong at 8.4%.
The combination of robust volume growth and softening input costs has created a strong positive environment for operating margins. This heightened profitability is essential for financing the aggressive capacity expansion plans underway across the industry. Major cement producers plan to add over 130 MT of grinding capacity between FY25 and FY27. Analysts anticipate that total cement volumes will grow by 6-7% in FY26, backed by sustained demand from both housing and infrastructure sectors.
The September 2025 edition of India’s Growth Pulse reaffirms India’s position as one of the fastest-growing major economies globally. The sustained momentum is underpinned by strong domestic demand, an ongoing shift towards investment-led growth, and significant policy reforms such as GST rationalization. Despite global uncertainties, the Indian economy continues to demonstrate resilience across key sectors including manufacturing, services, and agriculture. Inflation remains well-contained, and improvements in employment, particularly female workforce participation, signal positive structural changes. This tracker will continue to support policymakers, analysts, and stakeholders in monitoring the evolving economic landscape and guiding informed decision-making for sustainable growth.